
Religion in America
Latest updates:
Update Conifence in Oranized Religion and Other American Institutions - August 31, 2022
Update charts and narrative in Summary for newest data - January 29, 2022
Add "Digging Deeper: Confidence, Part 2 - Timeline charts of responses for each of 15 institutions - August 25, 2021
Update "Digging Deeper: Confidence - incorporated 2021 data, additional details and analysis - July 29, 2021
Update "Confidence in Religion and Other American Institutions" section- July 22, 2021
Addition of "Digging Deeper" sections - June 28, 2021
 About Religion in America. In 2012 Stu Johnson was the lead author of a report on the Religious Publishing Marketplace in America, produced by Simba Information for Zondervan/HarperCollins Christian Publishing. The chapter on Religion in America, a summary of survey research, some of it going back many decades, was compiled solely by Stu and subsequently extracted as a separate report.
About this page. The graphs on this page are selected slides from a more detailed PowerPoint® presentation that illustrates major trends in the American religious landscape. You can click on a graph to enlarge it. (It will open in a new tab.)
The primary data sources used include Gallup, Pew Research, and Barna Group. Data sources are shown on each chart. For some charts, the survey is repeated annually, others more sporadically, Each chart shows the latest data available at the time of the last update of this page.
Report Sections
(DD indicates more detail is available in one or more "Digging Deeper" pages):
• Executive Summary • The U.S. Compared to the World • The Changing Mix (DD) • Beliefs (DD) • The Importance and Influence of Religion in America (DD) • Confidence in Organized Religion and Other American Institutions (DD) • Defining Religious Cohorts
Executive Summary
Click on a Section header to go to that part of the report. Note beginning with "DD" describes a Digging Deeper page available for that section.
The U.S. Compared to the World
- In the U.S. the number of Christian adherents continues a decline that became noticeable around 1970 and is accelerating in the early decades of the 21st century. Those claiming Christian affiliation (Protestant, Catholic and non-denominational Christians) accounted for 93% of the adult population in 1964. It was 83% in 2000, then 68% in 2020. Meanwhile, those claiming no affiliation have been steadily climbing from 2% in 1964 to 21% in 2021 according to Gallup and 29% according to Pew.
- While Christian adherents are declining in the U.S., those who describe themselves as "born again" or "evangelical" remain relatively constant. Gallup starting asking the question in 1992, when 36% of adult respondents claimed to be born again or evangelical. The number peaked at 47% in 1998, then began moving down, ending at the low point of 34% in 2020, but rebounding to 36% in 2021, back to where it started in 1992.
The Changing Mix
DD on Composition of Religious Affiliation, with detailed demographics)
- Breaking the numbers down, it appears that most of the loss in Christian adherents is occurring among those who might be identified as "cultural" or "nominal" Christians, whose adherence has been driven by tradition more than personal belief and practice. This is clearly seen in the shrinkage of mainline denominations.
- The significant "rise of the nones" in the United States—those who claim no religious affiliation—has been accelerating since 2000 and is most noticeable among the youngest generations. A study in January 2018 by Barna, which includes 13-18 year-olds in Generation Z, shows a doubling of those identifying themselves as atheist (13%, compared to 6-7% for all older cohorts, including Millennial and Gen X). Where a sizable portion of early "nones" still retained an interest in spirituality, some have dubbed younger unaffiliated as the "rise of the Nones"—those who may have been involved with organized religion under the influence of family, but cut their ties completely in adulthood.
- Age Cohort, Political Party Preference and Geographic Region are the strongest indicators of variations in religious affiliation. In addition to the discussion of the Barna study of Generation Z later in this Summary, see Digging Deeper pages on Composition of Affiliates and Attendance at Religious Services for comparison with other demographic factors.
- Globally, Christian adherents represent the largest group, at 31%, followed by Muslim, Unaffiliated, Hindu, Buddhist, Other and Jewish. According to a 2018 Pew study,by 2050 Muslims will catch up with Christians as a proportion of world population, together claiming six in ten adults. The growth of unaffiliated will impact the U.S. more than the global population, according to the study.
Beliefs
DD on beliefs in God, the Devil, Angels, Heaven, and Hell
- Belief in God among Americans remains strong but showed signs of decline since the mid-1980s, paralleling but lagging behind the "rise of the nones," indicating the likelihood that belief in spiritual matters is distinct from affiliation with organized Christian religion. The expression of the belief has also been tempered by a softening of the survey question by broadening it from "do you believe in God" to "do you believe in God (or a Universal Spirit)?," which opens the door to a wider set of religious perspectives.
- Declining religious affiliation among younger age cohorts impacts beliefs about Science and the Bible, though an early study of Generation Z by Barna showed a possible break in that pattern among the newest age cohort.
- While nearly half of Americans believe the Bible is an "inspired Word," those who believe the Bible to be the "Actual Word" versus "Fables and Legends" have crossed paths in recent years, with the Fables and Legends view surpassing Actual Word in 2017, each camp represented by roughly one-quarter.
The Importance and Influence of Religion in America
DD on Attendance at Religious Services, with detailed demographics
- Those who believe religion is very important has dropped below the majority (48%) in 2020, falling 13% from its peak of 61% in 1998. There was a slight rebound in 2021 to 49%. On the other hand, those who see religion as not very important have slowly gained strength, beginning to compete with those who feel it is fairly important, a view that has remained more constant.
- Slightly more than half of Americans believe religion can answer today's problems, but the 41% divide with those who said No in 1994 narrowed to 11% in 2018, with a slight rebound since then, resulting in an 18% separation in 2021 (53% Yes, 35% No).
Confidence in Religion and Other American institutions
(DD on Confidence, additional tables and trend graphs by institution
- Americans have shown a steady erosion of confidence in major institutions—including organized religion— tracked by Gallup since 1973. (The confidence score is the combination of those responding "A great deal" and "Quite a lot").
In the 2020 report, issued in July during the early months of COVID-19, we saw a very uncharacteristic increase in confidence in two-thirds of the institutions.
In the update for July 2021 we saw a resumption of the overall decline in confidence. Gallup added Science as an institution, which came in at rank 3, pushing the other instiutions down by at least one ran from their 2020 order..
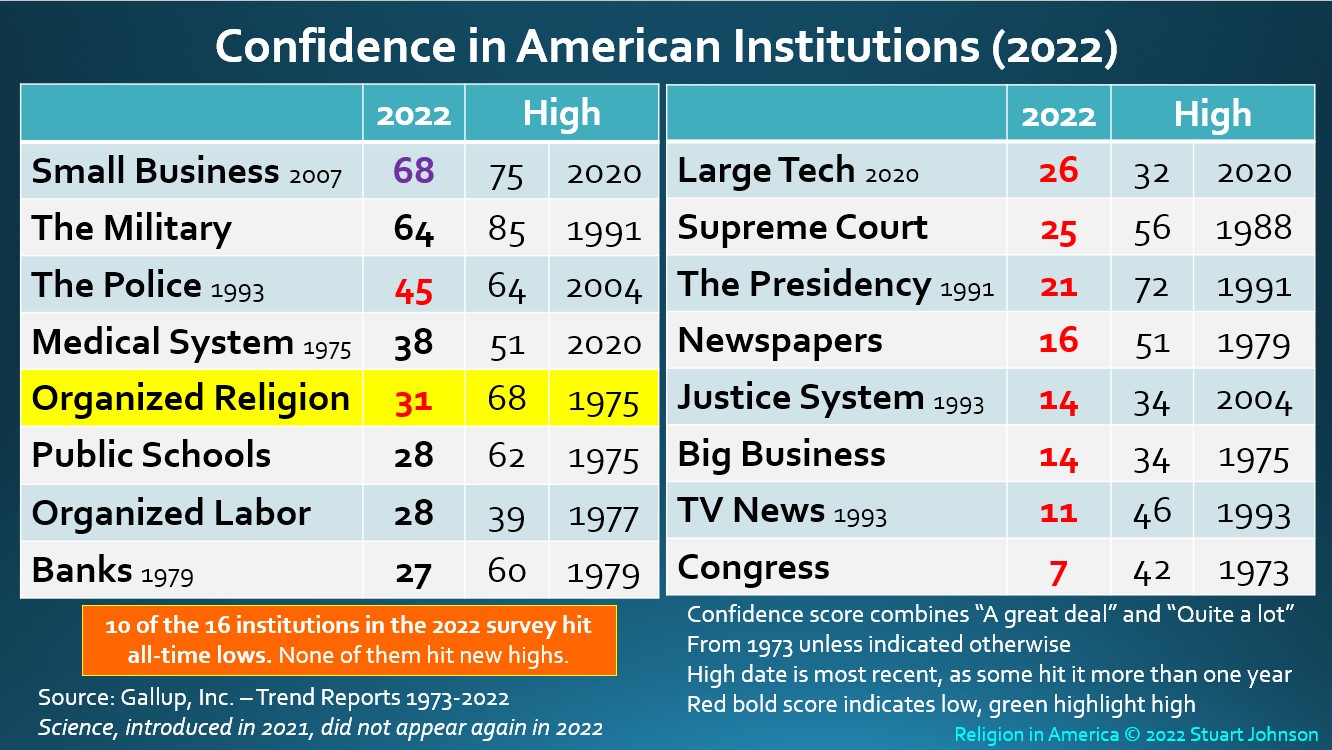
In the update for July 2022 ten of the sixteen institutions hit all-time low confidence scores. Scinnce did not return, but Large Tech remains in the survey for a third year.
- Organized religion was number 1 from 1973 through 1985. In 2020, it bounced up to 42% from a low of 36% in 2019. In 2021 Organized Religion lost almost all of its gain from 2020, and in 2022 it hit an all-time low of 31. Despite that, it increased two places in rank, to number 5, because Sciense did not return and The Presidency—which surpassed Organized Religion for the first time in 2021— fell 5 places in 2022.
Defining Religious Cohorts
- 2009: George Barna's Seven Faith Tribes - 66% Casual Christians, 16% Captive Christians, 11% Skeptics, 7% Other (Jews, Mormons, Pantheists, Muslims)
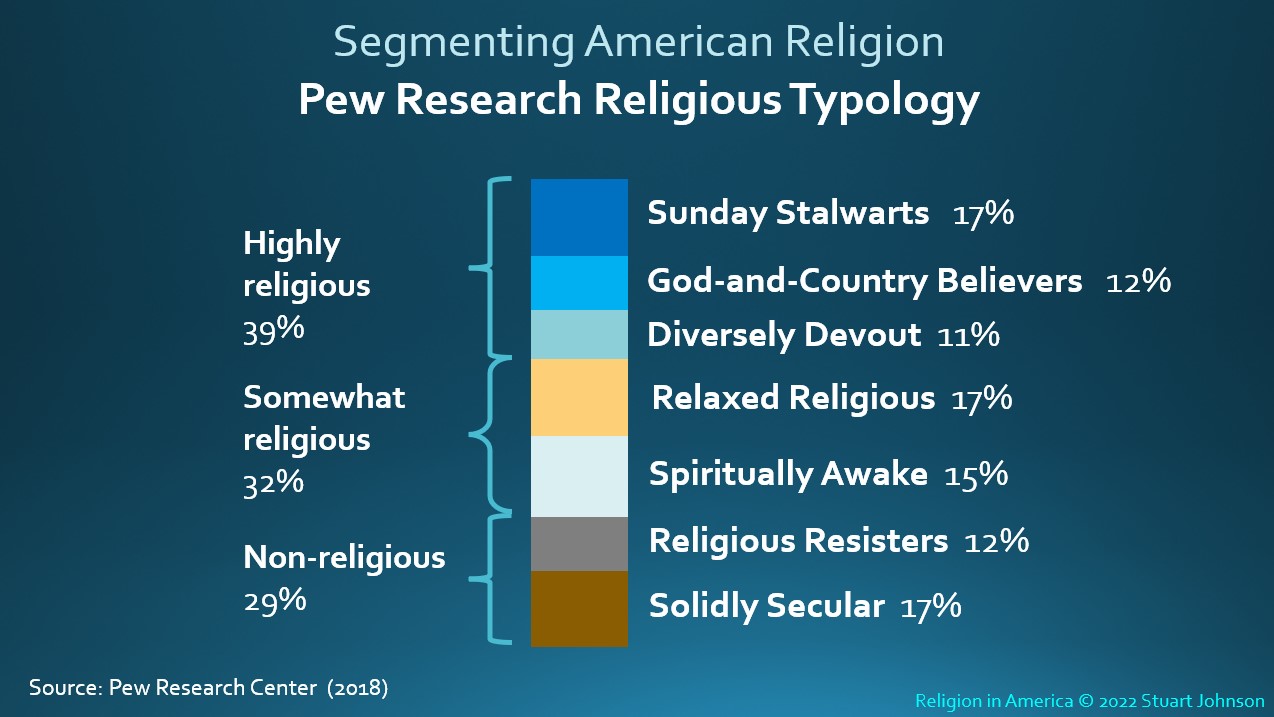
- 2018: Per Research Religious Typology - 39% Highly Religious (Sunday Stalwarts, God-and-Country Believers, Diversely Devout), 32% Somewhat Religious (Relaxed Religious, Spiritually Awake), 29% Non-religious
![]()
Look for the Digging deeper icon in sections below. It will lead to more detail on a particular topic, including demographic factors (gender, race, age cohort, geographic region, education, political party preference). This feature was introduced in June 2021 for four pages on Beliefs, Composition of Affiliates, Attendance at Religious Services, and Confidence in Institutions. Other Digging Deeper pages may follow as material becomes available.
The U.S. compared to the World
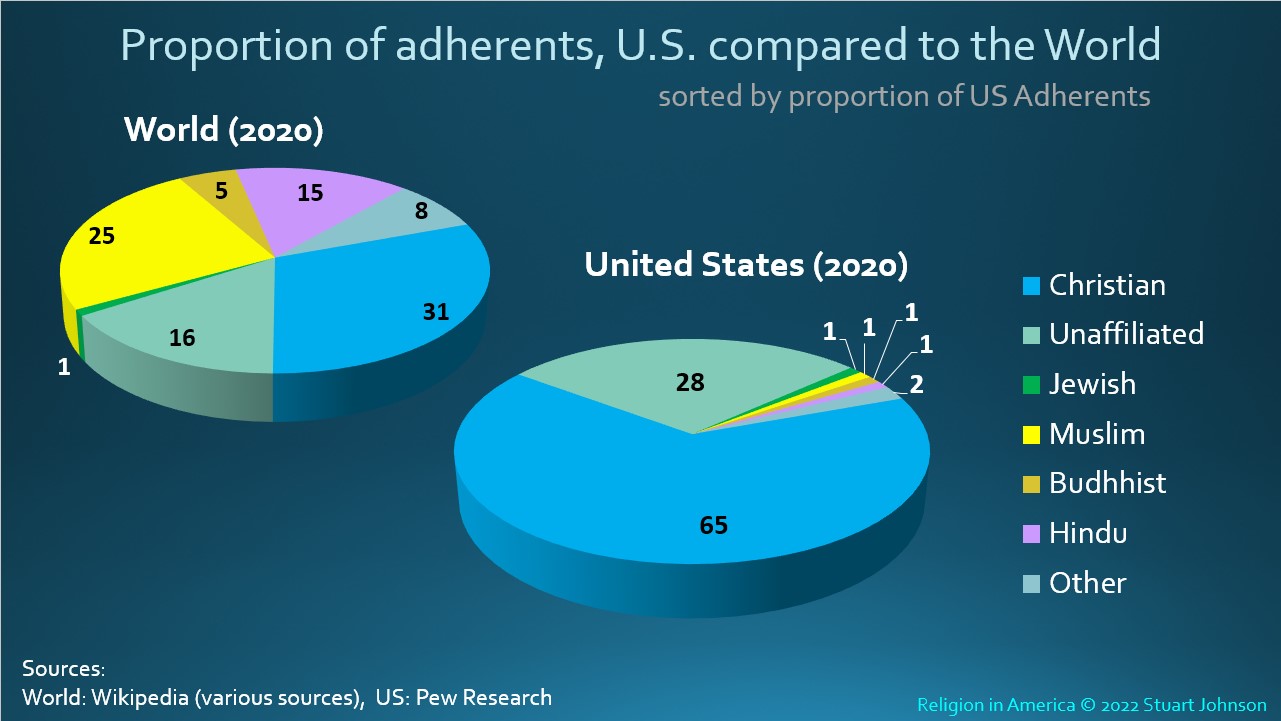
While Christian adherents have been declining, especially in the last two decades, the United States remains a predominantly Christian country—with 65% of adults identifying themselves as Christian in the most recent Pew polling. (Gallup shows 68%).
Around the world, according to various sources, Christians represented about half that level, with roughly three in ten of adults in 2020.
Pew suggests 28% unaffiliated in the U.S. in 2020, while Gallup puts it at 20%. The difference cannot be explained simply by margin of error, but by differences in survey methodology, question wording and interpretation of results. More on that as we dig deeper.
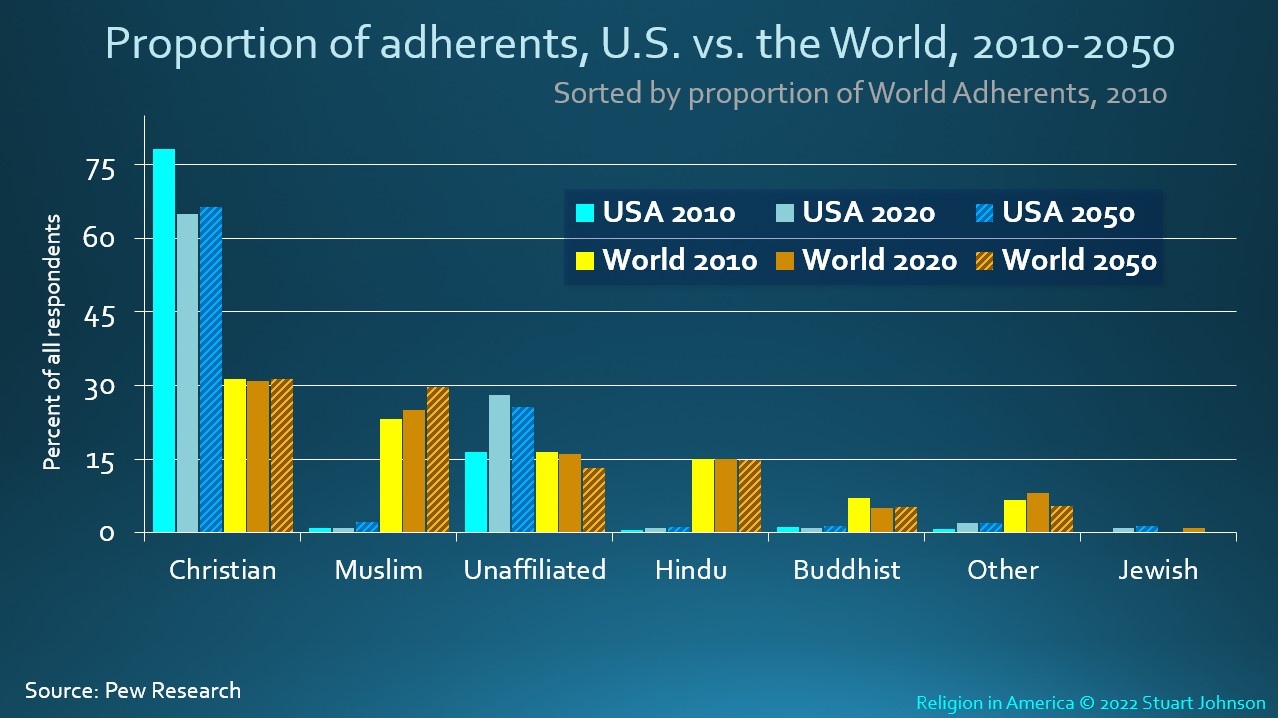
Though declining, Christian adherents are expected to dominate in the United States into the foreseeable future. By 2050 Pew predicts a drop from three-quarters to two-thirds of adults. In reality, we reached that level in 2018, according to Gallup and by 2020 it dropped to 65%.
Non-Christian religious adherents in the U.S. will increase some, but the most noticeable shift will be the continued increase of those with no stated affiliation. However, when looking at global projections, notice that Muslim adherents could match Christian by 2050. Most others, including unaffiliated, are seen as remaining the same or declining.
The Changing Mix
A 55-year trend
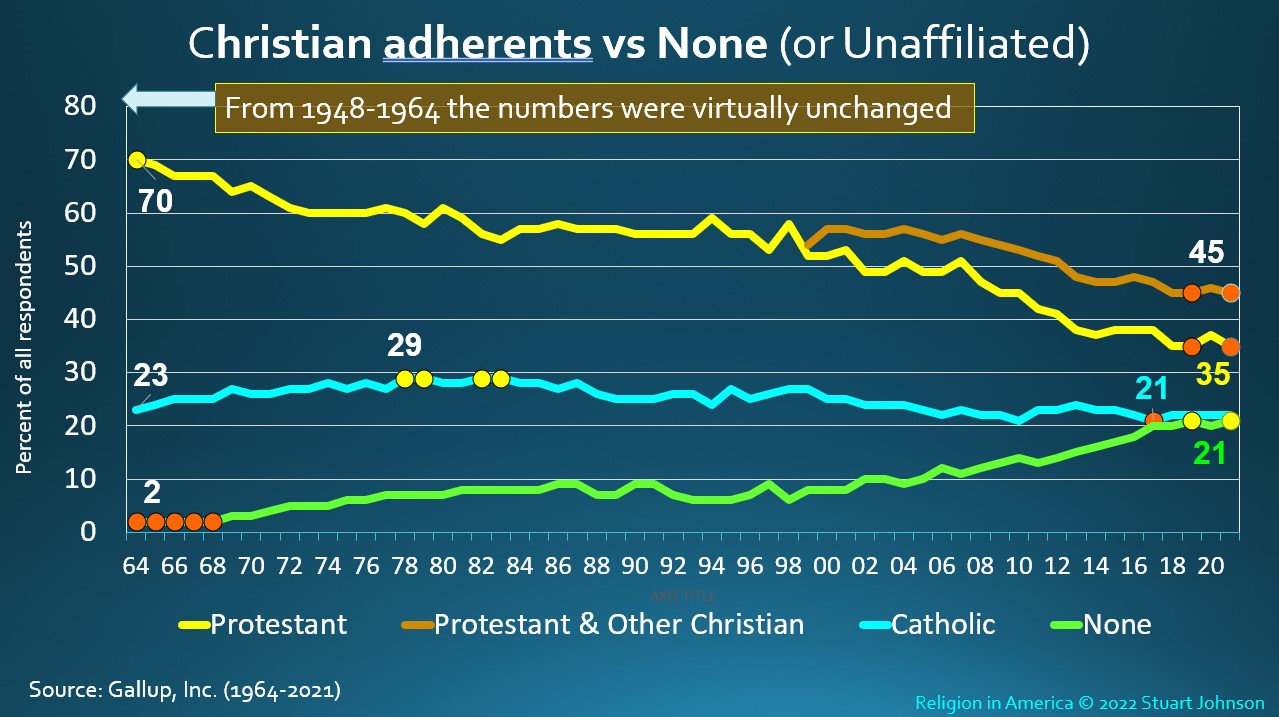
In many of the line charts in this report, orange dots represent low points on a line, yellow dots represent high points. There can be multiple dots for high and low points.
For much of the 20th century, Protestantism dominated the American religious landscape, with its adherents representing 70% or more of the adult population. Catholic adherents accounted for another one-quarter of adults, putting the combined total of Christian adherents well over 90% for many years.
Following World War II, Protestants and Other (non-Catholic) Christians declined from a steady 70% majority to just below 50% for the first time in 2012, according to Gallup. In 1998 Gallup began including "Other Christian" with Protestant. This reflects the rise of non-denominational churches as well as churches that do not promote their own affiliation with a denominational organization, so congregants may not know there is a denominational connection. Denominational Protestants fell below 50% of the population in 2006, while all Protestants hit that mark in 2012. Total Protestants fell to a low of 45% in 2019, but came back to 46% in 2020, then dropped back to 45% in 2021. While it is close enough to be within the margin of error, it is interesting that 2020 was the year that the COVID-19 pandemic swept around the world and the year of another contentious presidential election in the United States with its sometimes strange amalgam of religion and politics. We will see stronger examples in other charts below.
Catholics have held steadier, at roughly a quarter of the adult population, but show a steady decline from a peak of 29% in 1982 to a low of 21% in 2019, followed by a slight bump up to 22% in 2020 that continued into 2021. Meanwhile, those the no stated religious preference, have climbed steadily from nearly invisible through the 1960 to a course destined to surpass Catholics by 2018.
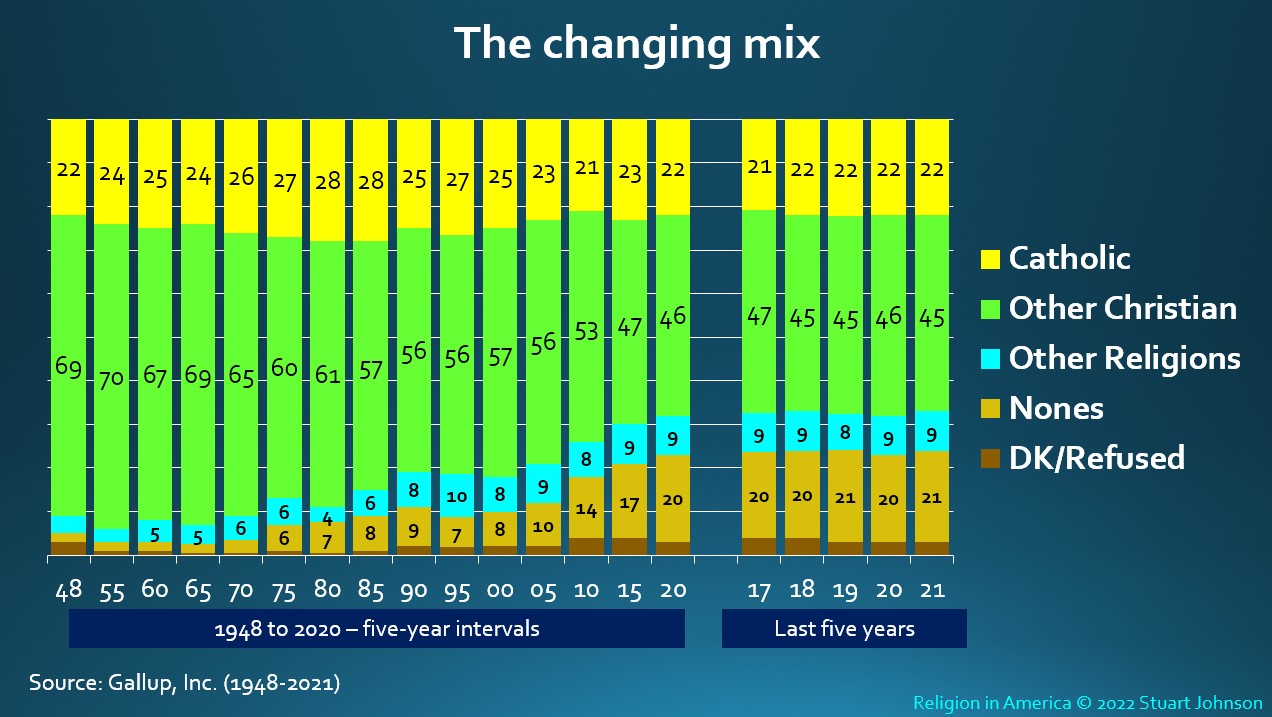
The rapid and nearly steady ascent of the "Nones" that began around 2000 plateaued over the last five surveys, hitting a high (for Gallup) of 21% in 2019, falling back to 20% in 2020, then back to 21% in 2021. Pew Research puts the non-affiliated closer to 30%, part of which I believe has to do with the way each survey causes people to interpret their connection with a religious tradition. Even with the less extreme picture painted by Gallup, it is clear that the way in which Americans identify their connection with religion—notably among the historically dominant Protestant majority—has undergone a huge seismic shift since 1970.
Initially, the increase in unaffiliated (commonly called "the rise of the nones") reflected a rejection of organized religion, with some "nones" remaining spiritually open. More recently, however, especially among younger generations, we are seeing growth in those who identify as agnostic or atheist. (See the charts on Generation Z below).
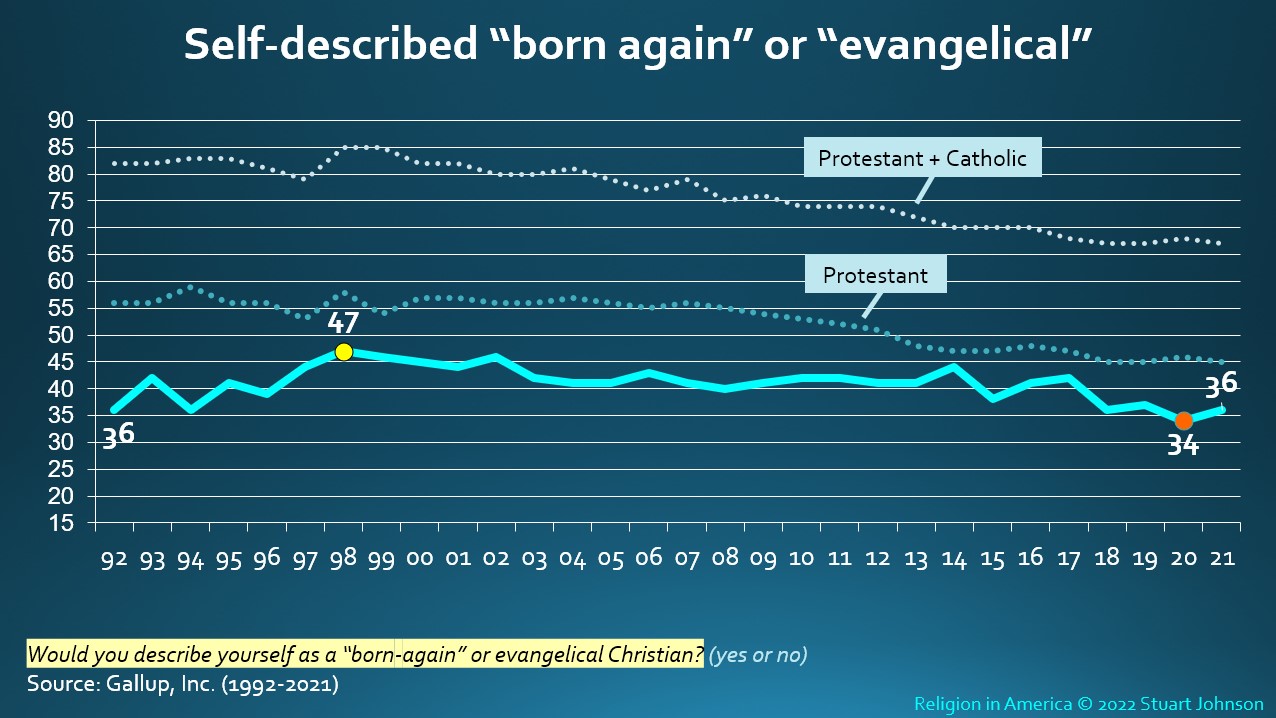
Since 1992, Gallup has asked people if they describe themselves as "born again" or "evangelical." As a self-description there is plenty of latitude and I believe the term "evangelical" was co-opted by the mainstream media in political analysis beginning around the 2000 presidential election, applied to what in the 1990's was called the Religious Right. That designation was represented by Jerry Falwell's Moral Majority and similar movements growing out the Fundamentalist stream of American Protestantism. Regardless, the shifting, even distorted, definition of evangelical would not impact Gallup's question because it includes the broader umbrella of born again.
George Barna developed a strict definition of evangelical, based on beliefs and behaviors, which narrows the group down to about 8% of the American adult population. Beyond those who fit this narrow definition, a third or more in Barna surveys have described themselves as "born again."
During the early 2000's, I was involved in research for Tyndale Publishing House during the height of the popularity of the Left Behind end-times series. During that time, Tyndale commissioned research, part of which indicated that Catholics compromised a good part of the audience for that series and many of them used "born again" to describe themselves. Therefore, while "evangelical" generally refers to a subset within Protestantism, those who identify themselves as "born again" can be found across Christian adherents.
Needless to say, it is interesting to note the rise of this group from the start of the question in 1992 at 36% of all respondents) to a high of 47% in 1998. From there, the trend has been slowly downward, but the low of 34% in 2020 is barely below the starting point back nearly 30 years ago, which was matched again in 2021. (The downward deflection in 2020, while very small, is opposite the minor upward deflection seen in the charts above related to self-identified affiliation. We have to be careful, however, in trying to find significance in changes of a point or two that fall within the margin of error.)
Compared to other indicators with far more significant change, the trend here is remarkably level. In fact, the proportion of self-proclaimed born-again/evangelicals among Christian adherents (including Catholics), at 52% in 2020, has actually grown, from 44% in 1992 to 54% in 2021. This could be attributed to the idea expressed by Ed Stetzer and others that "the rise of the nones" actually represents a winnowing out of nominal Christians for whom faith was more form and tradition than substance.
Addendum (added February 5, 2022)
It might be assumed that the relative constancy of this cohort must represent considerable cohesion among those who claim to identify as born again or evangelical. That may have been more true when Jimmy Carter talked about his "born again" experience, but it was at the time of the 2000 election that the Red-Blue divide began to literally color political discussion with increasing intensity—including the role of "evangelicals" on the red side of the divide.
While "evangelical" is a word with a long history, the tradition of evangelicalism that I came to know, which rose to prominence after World War II, attempted to distinguish itself from mainline denominations on the left and Fundamentalism on the right. In my understanding, that brand of evangelicalism was intended to engage the culture while recognizing the authority of the Bible.
By the 1990s the growth of television evangelists from the fundamentalist side (Pat Robertson and Jerry Falwell among others) gained enough exposure to acquire considerable political power. Especially after the 2000 election, the major media began to drop the "Religious Right" label and conflate the differences between the movements to the single label "evangelical" which made it easier for the broader culture to view all conservative Christians as one cohort.
If viewed primarily as a political movement, how can such "evangelicals" engage the culture in the tasks that Christ set out for his church when he emphasized the two greatest commandments, to love God and love your neighbor? These parallel the words of Micah in the Old Testament to act justly, love mercy, and walk humbly.
Added to the drift toward political power, the fallout from the 2020 election and the COVID-19 pandemic saw an alignment of "evangelicals" in the public mind (through the lens of traditional and social media) with conspiracy theories and misinformation about election fraud and the pandemic. Piling on even more, from the center of "genuine" evangelicalism came a wave of scandal, with prominent leaders and churchers involved in financial misdeeds, abuse of power and moral failure. For a good discussion of what has happened, see David Brook's February 3, 2022 opinion piece in the New York Times "The Dissenters Trying to Save Evangelicalism from Itself."
All of this has produced consideable angst and an identity crisis for many in the evangelical center. Some of my acquantances, being disturbed and embarrased by it all, no longer feel they can call themselves evangelical.
It reminds me of the times in the Baptist church we attended when we considered changing the name because "Baptist" was thoght to have acquired negative connotations, yet we resisted because Baptists in general (being such a diverse movement today) have such a rich, positive history, including their role in America defining the religious liberty embraced in the First Amendment of our Constitution. In a similar way, how will Gallup's question "would you descirbe yourself as 'born again' or evangelical?" play out in the future? Only time will tell.
The changing mix: Other religions
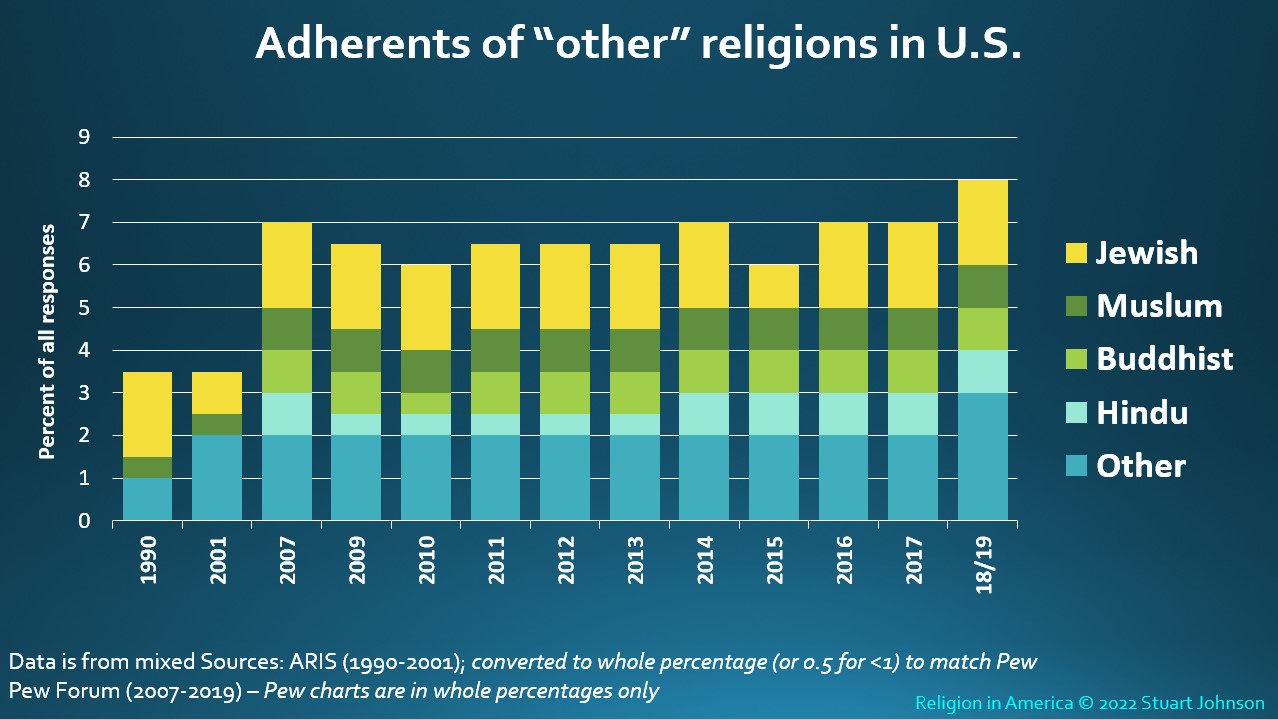
The data comes from different sources. Because the numbers are small (within the error of margin for most surveys), we can only make a few general observations.
Clearly, there has been some increase in Other religions, yet they still represent a very small portion of the adult population in the U.S., growing most notably between 1990 and 2007, then varying one or two percent since then. (1% is still 3.3-million people out of a population of 332-million.)
Jews have remained between one and two percent in surveys since 1990.
Muslim adherents remain a smaller segment than many people might assume, given exposure in news and politics (and confusion between religion, ethnic background, and national origin). The growth shown by 2010 seems to have settled back to just under two percent.
Adherents of Other non-Christian religions (which represent many groups) are growing, up three-fold since 1990, and greater than the combined total of Jews and Muslims.
None does not equal Atheist, but does mean young
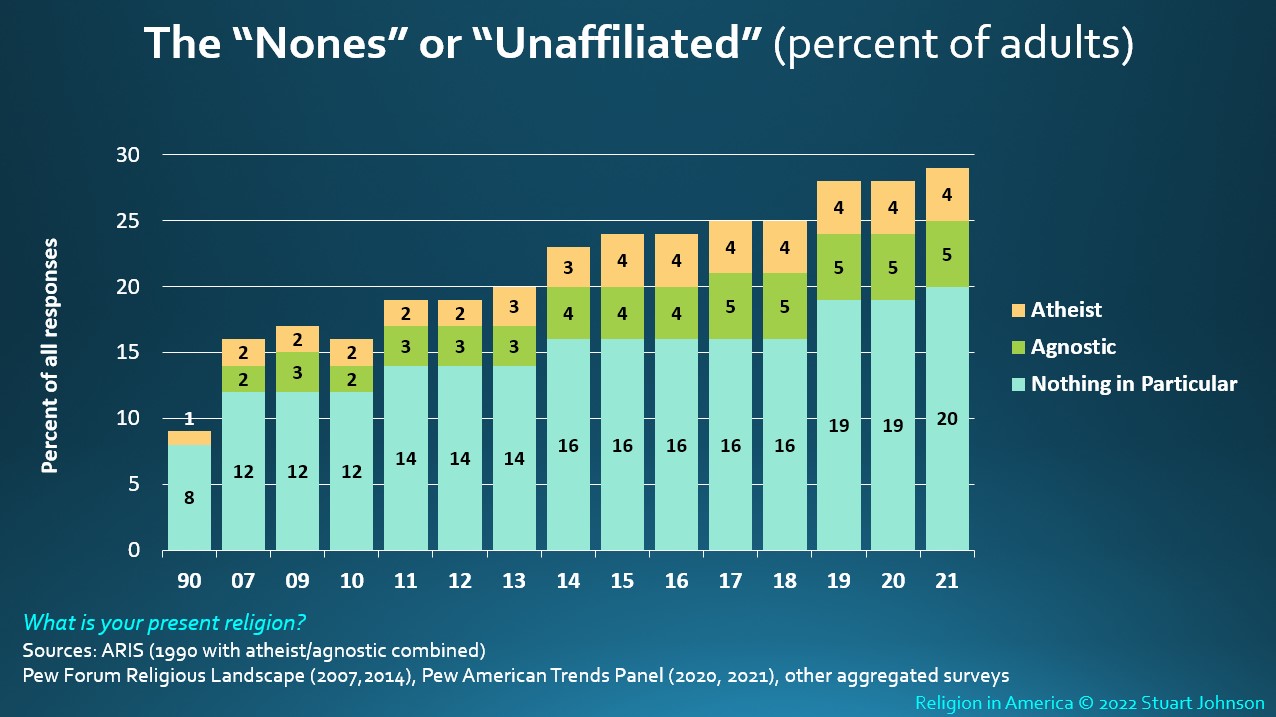
Prior to 2018, a breakdown of those who claimed no religious affiliation showed some growth of those who identify themselves as Atheist and Agnostic, but the greatest growth was among those who simply have no preference. (Compare this chart with the earlier one showing Gallup results, which shows unaffiliated ("None") about 5-8 percentage points below Pew throughout the time covered here).
From 2008 through 2016 Pew divided unaffiliated ("nothing in particular" in this chart) into Secular and Religious Unaffiliated. Starting with a nearly even split in 2008 (close to 6% each), by 2016 the gap widened to 14% Secular and 3% Religious. The distinction has faded to the point that Pew no longer asks about it.
The presence of the seemingly paradoxical "Religious Unaffiliated" is an indicator of the discomfort that a number have had with organized religion, especially as the rise of the Nones began to explode. In 2008, Pew found that when Unaffiliated were asked a number of questions about spiritual issues, they could be divided between Religious—those who claim that spiritual factors are important to them—and Secular—those who claim little or no importance for spiritual things.
It appears that those with spiritual interest began to decline, so the most recent division between Atheist, Agnostic, and Nothing in Particular shows how significant has been the move away from organized religion and religious belief, especially in the second decade of the 21st century.
As shown in the chart, Pew reported "Nothing in Particular"
at a high of 20% in 2021, up noticeably from five years at 16% (2014 through 2018), while the Atheist/Agnostic split has remained 4% and 5% since 2017.
An increasing generation gap
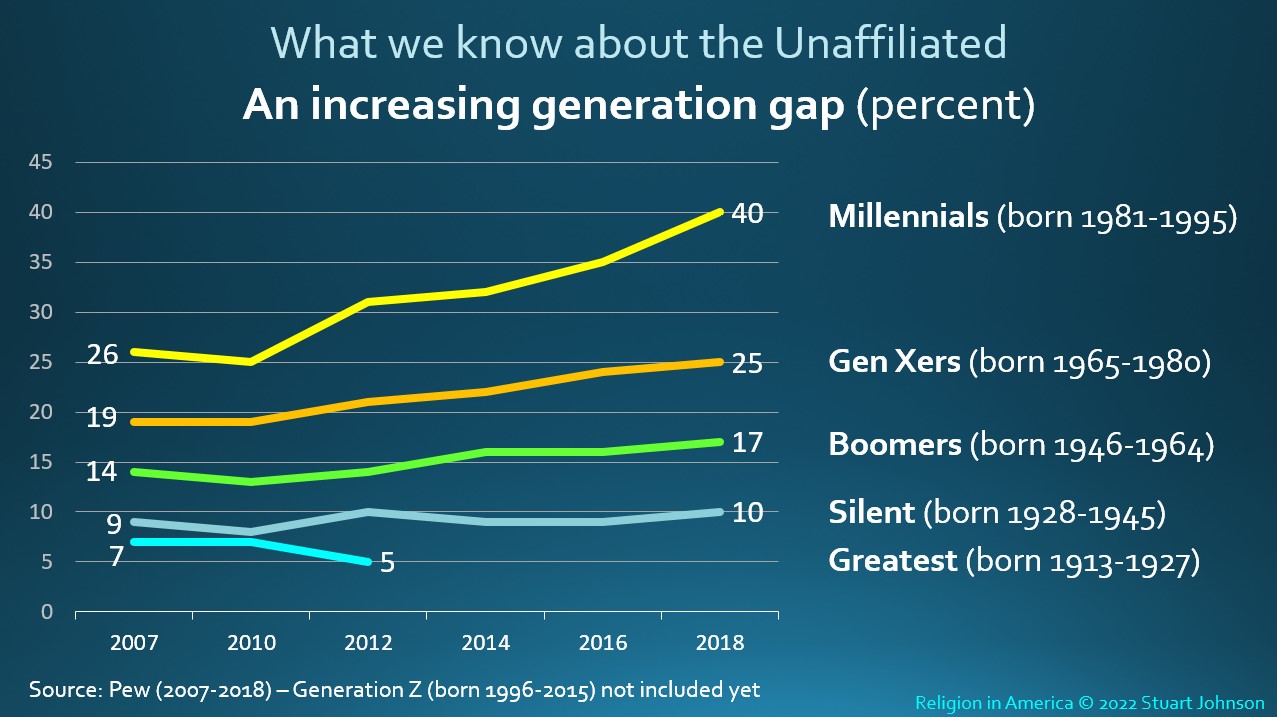
When viewed by generation, it is striking to note the accelerating growth of the unaffiliated with each succeeding generation. The proportion moves from 10-percent or less unaffiliated for those born before the end of World War II in 1945, to more than a third of the youngest generation.
Note that Pew shows unaffiliated Millenials in 2018 ten-percent above a similar breakdown by Barna in the next chart. In the other age cohorts, Barna shows higher unaffiliateds than Pew by a smaller margin. The lesson here is that survey research is most useful to show trends over time than a high degree of precision at any one time. As already pointed out, this is often due to differences in research methodology and how questions are framed and interpreted.
Meet Generation Z
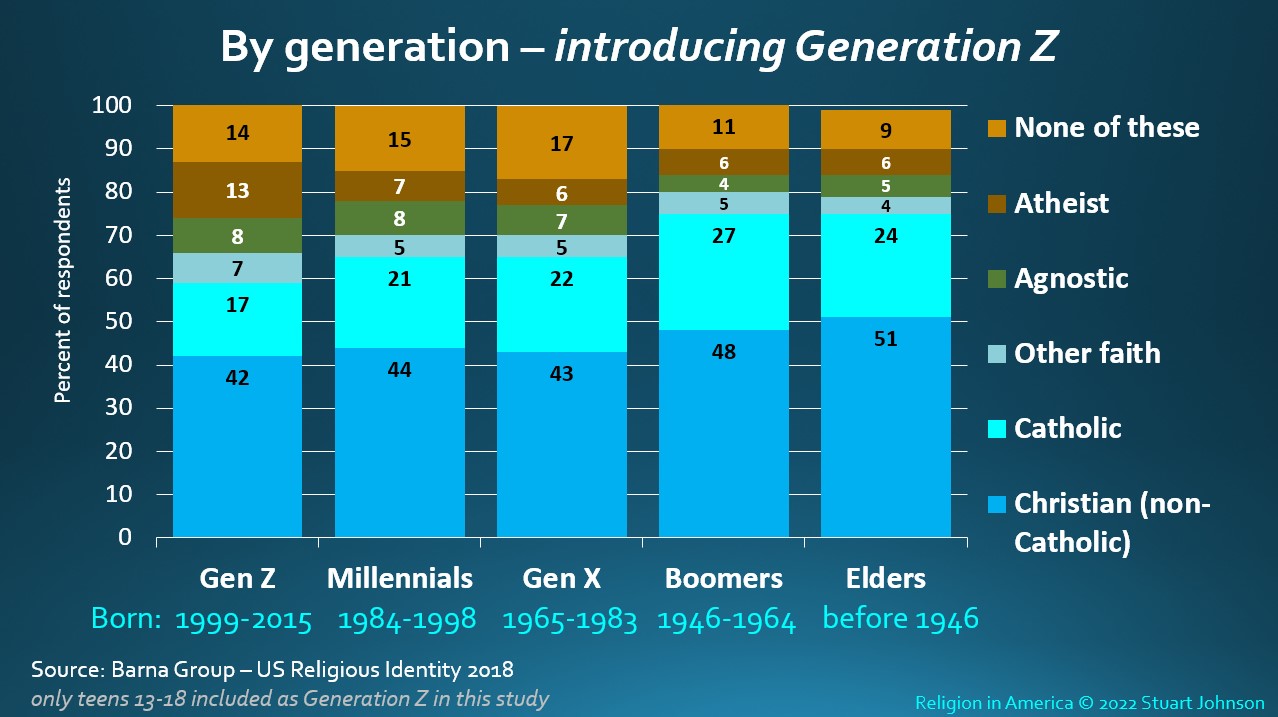
In a study released in January 2018, Barna Group revealed a startling indicator of the depth of age-related disconnect with organized religion.
The youngest age cohort, known as Generation Z, or Gen Z, shows a 5-point increase over Millenials in not claiming a religious affiliation. Most significant: all of the increase and more came from those claiming to be atheists.
The Barna report reveals much more detail, which was the subject of an InfoMatters blog, "Generation Z," posted in February, 2018.
Beliefs
Belief in God
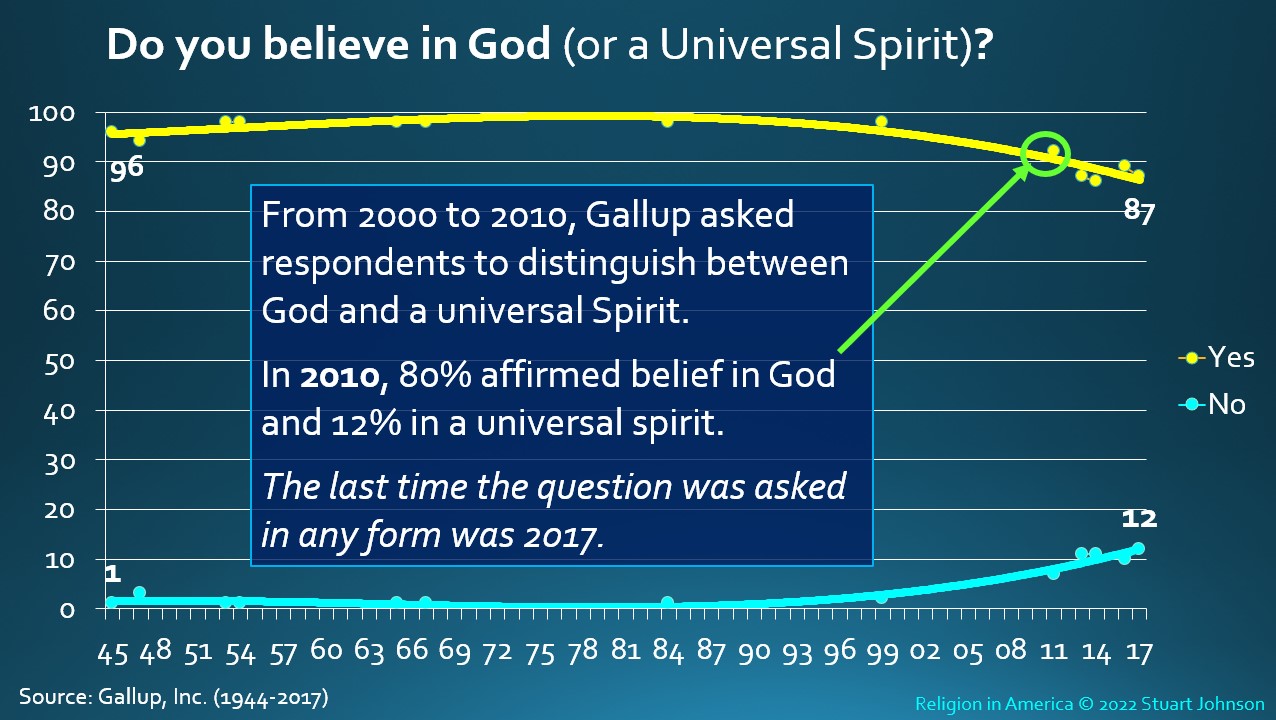
The trend indicated by this chart, developing since 2000, is very obvious (and corresponds to the "rise of the nones" discussed throughout this report). This is the longest-running of the Gallup questions on religion, going back to 1945. As you can see, belief in God was nearly unanimous from the end of World War II to the last decade of the 20th century. Since then, it has begun to erode noticeably. When first asked, the question referred only to "God," but in more recent years it has referred to "God or a Universal Spirit."
Science and the Bible
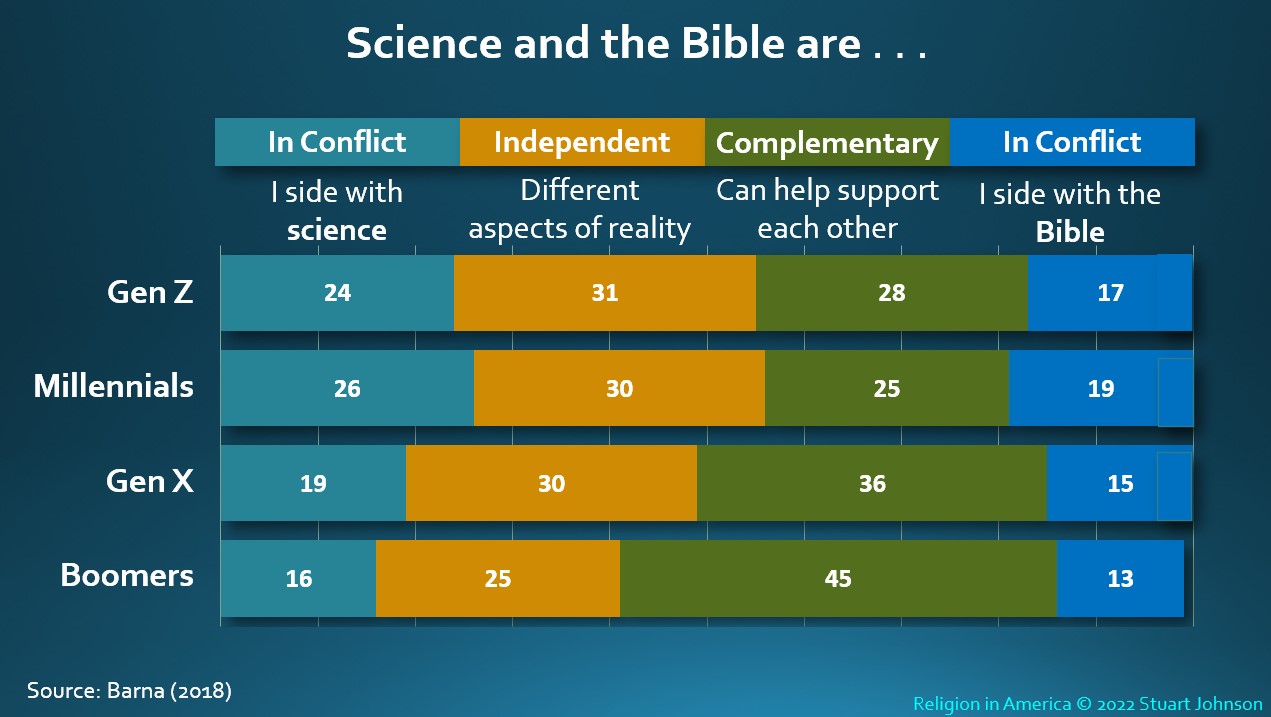
The Gen Z study asked about respondents' views of science and the Bible. In general, younger generations side with science or view science and the Bible as independent, expressing different aspects of reality. A diminishing proportion see the Bible and science as complementary, while the number who side with the Bible when there is apparent conflict increases with the youngest generations.
This may seem counter-intuitive, but could be due to the strong influence among some home schoolers and Christian academies, "young earth" groups and others taking exception with scientific assumptions about the origins of life and the age of the earth.
Beliefs about the Bible
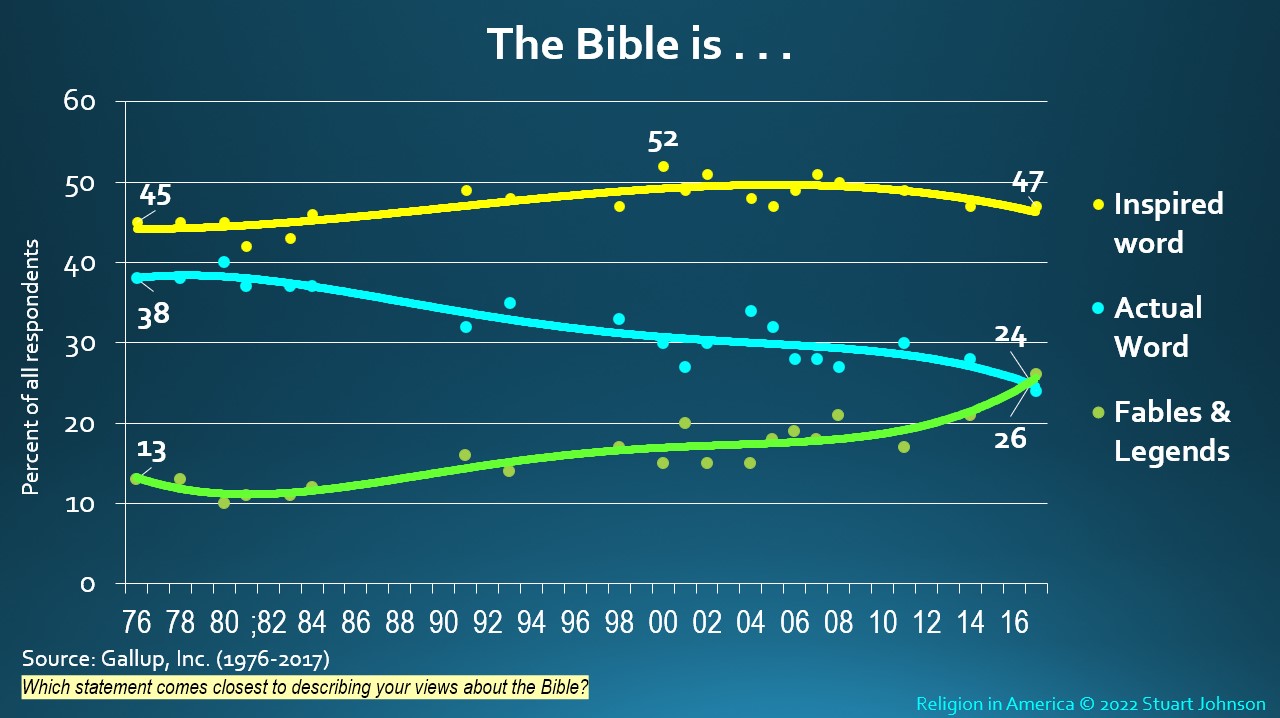
An interesting parallel to the Science and the Bible chart above is data from Gallup on views of the Bible.
What I find striking is that those who perceive the Bible as the inspired word of God have remained fairly steady since 1976. On the other hand, those who take a more literal view have declined by 12%. While it does not represent the movement of individuals, the decline is not matched by a growth in Inspired, but rather by an 11% increase in those viewing the Bible as Fables & Legends. The two lines converged in the latest survey in 2017. Unfortunately, the survey has not been done again, which would likely show those two lines continuing to move further apart, in opposite directions. [Unlike other charts, which represent annual surveys, the colored dots show the value in years the survey was conducted, with the solid lines showing the overall trend.]
![]()
See more details about BELIEFS
(God, Devil, Angels, Heaven, Hell)
The Importance and Influence of Religion in America
How important is religion in your life?

Both "very important" and "fairly important" show declines over 25 years. "Very important" is off 12% from the peak of 61% in 1998 and 2003, up slightly in 2021 after hitting a low of 48% in 2020.
"Fairly important" fell 7% from its starting point of 29% in 1992 to its low of 22% in 2016. From there it has rebounded slightly, ending at 27% in 2021.
"Not very important" moved up sd much as 15% in nearly three decades, crossing the slowly declining "fairly important" line in 2016, matching it in 2019, rising to 27% in 2020, but dropping again to 25% in 2021 as the two lines look like twisted ropes in the last three years (remember, however that this could easily be within the margin of error for such research). This growth exceeds the "rise of the nones" in the same time period, which went up 10% (some earlier converts to none could have shifted from religious to secular unaffiliated).
Ability of religion to address today's problems
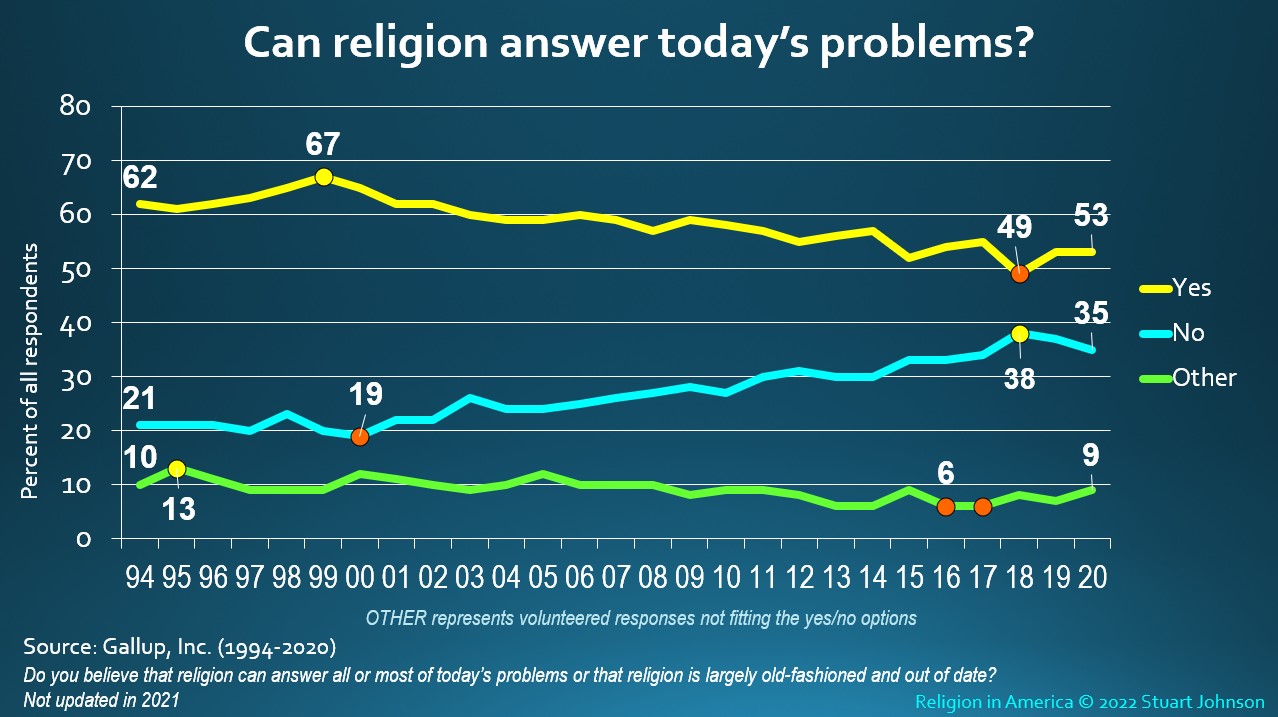
The decline for "yes" is greater than that of personal importance on the previous chart—a decline of 18% since the peak of 67% in 1999. However, Yes moved up 4% in 2019 to 53% and stayed there into 2020. (This question was not updated for 2021)
Those who felt that religion "is largely old-fashioned and out of date" ("No" on the chart) rose fairly steadily by 17 points, from 21% in 1994 to 38% in 2018. As with Yes, it reversed course in the next two years, ending at 35% in 2020—a likely temporary change of direction in the overall steady climb. What is interesting is that the low for Yes and the high for No both appeared in 2018, with the change of direction occurring before COVID and other events of 2020. Over the next few years, that may level off into a blip in time. How long now before the No's outnumber the Yes's?
The influence of religion
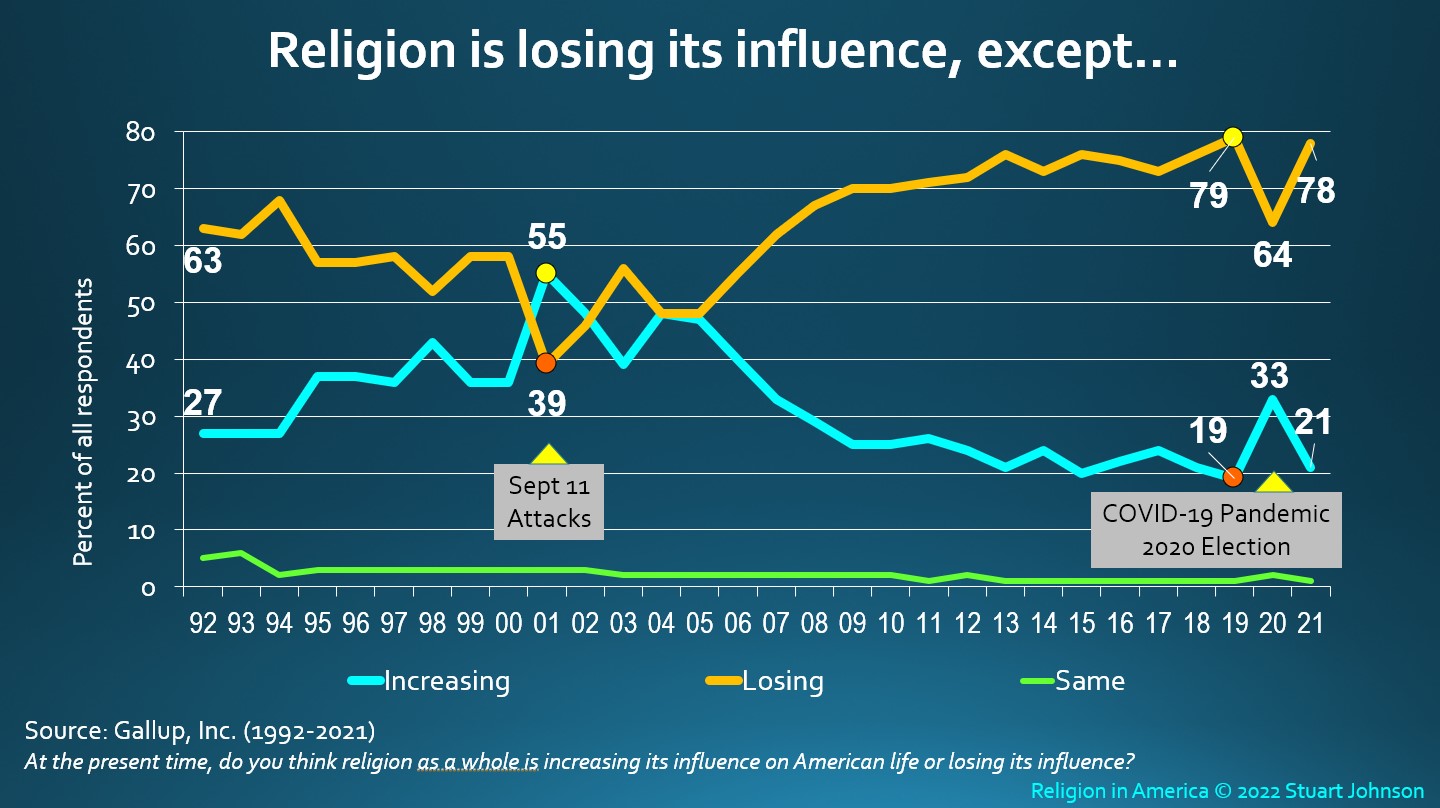
Here, the change is much more dramatic, with a combination of a general trends and two marked reversals that coincided with the September 11 terrorist attacks on America in 2001 and the first year of the COVID-19 global pandemic in 2020. "Losing" is a mirror image of "Increasing," and since it dominates, let's look at the overall trend. From 1992 through 1998, "losing" was trending down (meaning "increasing" was rising). The influence of religion seemed to rebound a bt in 1999 and 2000 (a new millennium, along with the election of George W. Bush and what I have observed as the increased partisanship with media focused on red and blue states, along with lumping Fundamentalist and Evangelical branches of Protestantism under the "evangelical" label).
Then came September 11. Since the Gallup poll is updated in November, it would have had a strong influence on survey responses that year, which showed a sharp reversal, with increasing jumping to a high of 55% while losing hit its low of 39%. The trend reversed again for two years, then like a winging pendulum reversed again until the two opinions met at just under 50% for two years (2004-05). From there, coinciding with one of the most noticeable periods in the "rise of the nones," losing kept moving up to a high of 79% in
2019, while increasing descended to a low of 19%.
Then came COVID-19 and the contentious Presidential Election of 2020. With a response similar to September 11, the lines radically reversed, with Losing dropping 15 points to 54% and Increasing bouncing up 14 points to 33%.
Was it COVID or the 2020 presidential election? The election itself, and the controversy over Donald Trump's claims of a stolen election following his loss would not have occurred until after the survey was conducted, but the climate of the election campaign, with much coverage of the influence of "evangelicals" as Trump supporters could have been a bigger factor than COVID itself (lockdowns created much political reaction and the vaccines were still months away).
That reversal collapsed nearly completely in 2021, though COVID continued and by the time Gallup would have conduced its survey respondents would have been aware of early success of vaccines which was then dampened by the delta variant to which the unvaccinated (many popularly identified as "evangelical Christians") were vulnerable, followed by the omicron variant which was emerging as the survey was conducted. This combined with reaction to ongoing controversy over the 2020 election and the January 6, 2022 attack on the U.S. Capitol by Trump supporters, could help explain why 2020 looks like a dramatic but isolated interruption to the long-term trend of religion losing its influence.
Membership and attendance
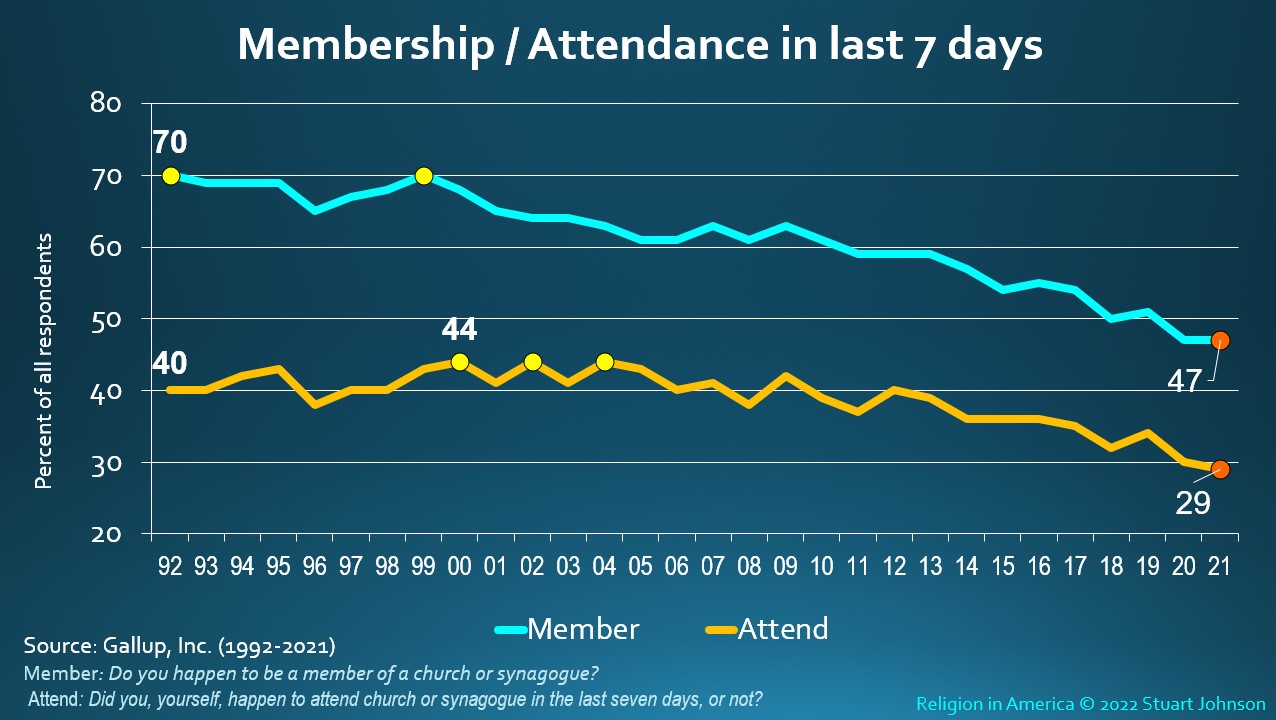
Membership has fallen faster than attendance, pointing out that the importance of membership (which requires a formal process in most religious bodies) has itself been in decline. Some are content to attend without being official members. Furthermore, while many churches may still distinguish between members and attenders, it is unclear whether respondents make that distinction. This is true not just of religion, where membership is usually distinct from attendance, but across the spectrum of organizations in society that are dependent on membership (service clubs, scouting, etc.) .
At any rate, while it is clear that immediacy of attendance (in the last seven days) remains lower than having a sense of belonging, attendance has declined by less than half (11%) that of membership (23%) since 1992. The significance of the comparison in the chart is that membership does not matter nearly as much as it once did, at least as reported by individuals (as Gallup is doing). Attendance is a much more powerful indicator of the influence of religion in America, with frequent attenders (once a week) a shrinking minority since 1992. The charts in the Digging Deeper section provide additional (and perhaps surprising) insights into the demographics of attendance.
![]()
See more details about ATTENDANCE
(gender, race, party preference and more)
Confidence in Religion and Other American Institutions
This section was last updated August 31, 2022, following release of the results of the 2022 Gallup survey on institutional confidence.
Gallup began its annual survey of confidence in American institutions in 1973. The question is stated "Now I am going to read you a list of institutions in American society. Please tell me how much confidence you, yourself, have in each one -- a great deal, quite a lot, some, very little, or none?" The score in the charts and referred to as being confident represents those who responded "a great deal" or "quite a lot."
Survey results are released each July, so results may reflect events in the first two quarters of a given year as noted below.. It is also important to point out that the results of any public opinion survey have a margin of error determined by sample size and methods of selecting participants, For this Gallup survey, the margin of error is typically 4- to 5-percent. Taken together, these factors indicate why trends over time are more significant than relatively small changes from year to year.
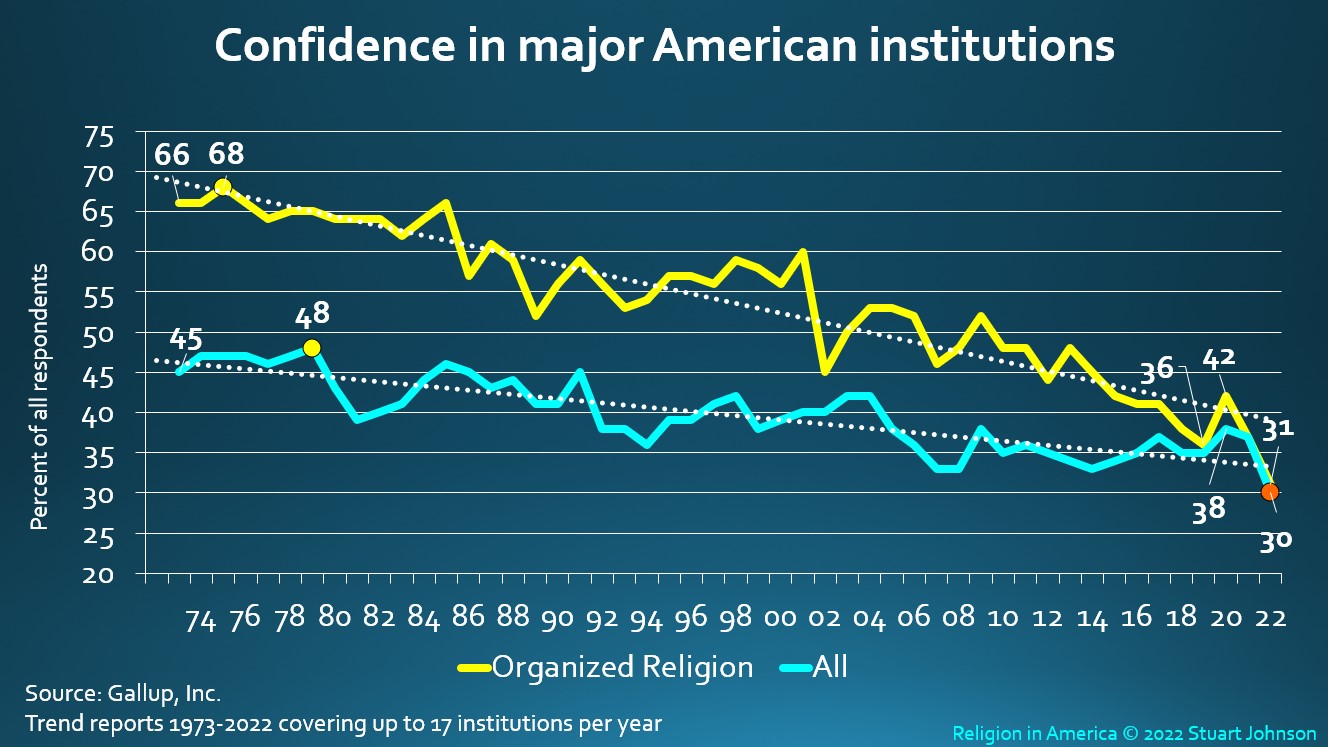
In 1973, the first year Gallup conducted its annual measure of confidence in major institutions, "the church or organized religion" was rated the highest among 15 institutions, 21 points higher than the average for all 15 (and clearly above the margin of error). Over the decades since then, however, overall confidence has steadily fallen, with Organized Religion declining at a more rapid pace than the others combined—to the point that Organized Religion in 2022 is only one point higher than all institutions surveyed (though that is within the margin of error, which is ±1.5 points at that level ).
Organized Religion continued to rank first through 1985, then fell below 60%. Among the reasons: Televangelist scandals, child molestation by priests; then a general decline in religiosity continued the downward trend (as scandals in Catholic and Protestant churches continued). Organized Religion dropped 32% from its high of 68% in 1975 to 36% in 2019). In 2020, the survey reflected the early months of COVID with many congregations under lockdowns and scrambling to stay connected through various online options, Organized Religion rebounded to 42% in 2020, but settled back to 37% in 2021 even as many congregations were opening up. In 2022 Organized Religion hit an all-time low of 31%—bringing the total decline from high to low to 37-points, down to less than half of where it started.
At the same time that Organized Religion has been racing to the bottom, confidence for all institutions in the survey has fallen 18% from a high of 48% in 1979 to its new low of 30% in 2022. There was a noticeable upturn in 2020 across two-thirds of the 15 institutions, most likely attributable to positive attitudes toward the responses of those institutions to the COVID-19 pandemic., A counterpoint, however, was the downturn for Police and TV News, with George Floyd's death at the hands of police in Minneapolis occurring shortly before the survey results were released in July.
While 10 of the 16 institutions have had 50% or more confidence at some point since their inclusion in the survey, only two can make that claim now. In 2022 all 16 institutions declined in confidence from 2021 and ten of the sixteen hit all-time lows.
There have been numerous ups and downs in confidence across institutions throughout the 50-year history of the survey. What we can see in the past three years is worth noting. In 2020, with the survey taken in the early months of the COVID pandemic, confidence in several institutions increased significantly in what appeared to be an expression of empathy for the people in those institutions affected by lockdowns and restrictions imposed by efforts to cope with the virus. The "COVID bump" was just that however, as things began to turn downward in 2021 and accelerated into 2022, with all institutions down and 10 of them at their all-time lows.
An interesting side note for 2022 is what I see as a "ripple effect" in responses that keeps the Overall Confidence (including Some) in a majority
for all but the lowest ranking institutions. For most of the institutions in 2022, the downward drop in Confidence Score is a result of Great Deal going down, while Quite a Lot remains close to or at 2021 levels. The downturn in Great Deal ripples down to an increase in Some, thus keeping Overall Confidence close to 2021 levels. I see this as a growing "lukewarm" sense of confidence with the majority of the institutions in the Gallup survey. Only the lowest begin to move into majorly Very Little or None. This is reflected somewhat in what follows, but you can find much more detail in the "Digging Deeper" links at the bottom of the page.
In 2021, Science was added as the 17th institution, taking third place, pushing the rest of the list down at least one place from their 2020 rankings. Science was dropped in 2022 (I commented last year that I did not think it would last because "science" is not like the other institutions which can be associated with specific organizations. Large Tech was added in 2020 and remains in the list—it can be identified with companies that rival government in power: Amazon, Apple, Facebook, Google, Microsoft and Twitter, among others, all of them part of yet distinct from Big Business, so worthy of their own status as an institution. .
Looking at the 2022 results, Small Business and The Military stayed in the top two spots, but each were down in score from 2020 when Small Business hit its high. In fact, all 16 institutions are down in score from 2021. Because of the presence of Science last year, 12 of the institutions rose in rank despite declining confidence (8 would have simply stayed in place compared to last year were it not for the one year appearance of Science at number 3. Falling in rank were the Supreme Court, down 11 points and two ranks to Number 10, and The Presidency, down 15 points and six ranks to Number 11 (it was only institution to move up in rank last year). .
Organized Religion lost all of its 2020 bounce, coming in at an all-time low of 31 for 2022. It did manage to move up two ranks, due to the one-year tenure of Science at number 3 last year and the fall of The Presidency to an even-lower score and ranking (most years it was behind Organized Religion, but last year was just ahead of it by rank).
Despite all the media coverage that might lead you to assume a stampede in the other direction, The Police recouped third place from Science, which did not return in this year's survey. It did drop six points, establishing a new all-time low at 45 (the highest of the new lows this year).
Including "Some" confidence in the score would bring a number of the weakening institutions above 50%, but that is only stretching things to reach levels once achieved by "A Great Deal" and "Quite a Lot." An analysis in the Digging Deeper section will show trend charts for individual institutions that makes the distribution by response over time more clear.
Spanning more than 20 points between their high and low scores are 13 of the 16 institutions for 2022 (last year there were 10). Six hit their low in 2022, Criminal Justice hit it in both 1993 and 2022. Five never had majority confidence (over 50): Congress, TV News, Criminal Justice System, Big Business and Organized Labor.
- The Presidency - 49 points between its high of 72 in 1991 and low of 23 in 2022 - median score: 39 - 23 now
- Banks - 39 points between its high of 60 in 1979 and low of 21 in 2012 - median score: 41 - 27 now
- Organized Religion - 37 points between its high of 68 in 1975 and low of 31 in 2022 - median score: 56 - 31 now
- Public Schools - 36 points between its high of 62 in 1975 and low of 26 in 2014 - median score: 39 - 28 now
- Congress - 35 points between its high of 41 in 1973 and low of 7 in 2022 - median score: 24 - 7 now
- The Military- 35 points between it high of 85 in 1991 and low of 50 in 1981 - median score: 66 - 64 now
- Newspapers - 35 points between its high of 51 in 1979 and low of 16 in 2022 - median score: 33 - 16 now
- TV News - 35 points between its high of 46 in 1993 and low of 11 in 2022 - median score: 26 - 11 now
- The Supreme Court - 31 points between its high of 56 in 1985 & 1988 and low of 25 in 2022 - median score: 45 - 25 now
- The Medical System- 20 points between its high of 51 in 2020 and low of 31 in 2007 - median score: 39 - 38 now
- Organized Labor - 20 points between its high of 39 in 1971 and low of 19 in 2007 & 09- median score: 26 - 28 now
- Criminal Justice System - 20 points between its high of 34 in 2004 and low of 14 in 1993 & 2022 - median score; 24 - 14 now
- Big Business - 20 points between its high of 34 in 1975 and low of 14 in 2022 - median score: 24 - 14 now
What does the overall decline of confidence say about the future of our society when we have so little trust in our bedrock institutions? What can the Christian church (and other faith communities) do at the individual and local level to restore trust when organized religion itself has fallen so far?
![]()
See more details about CONFIDENCE IN MAJOR AMERICAN INSTITUTIONS
Part 1: Trends, Comparison to Medians/Highs, Including "Some", Breakdown of Historic Highs/Lows
Part 2: Demographic breakdown of responses for each institution
Part 3: Trendlines of responses for each institution
Part 1 was last updated August 31, 2022, Part 2 was added September 9, 2021 and Part 3 was updated September 14, 2022.
The next annual updates should be posted in August 2023.
Defining Religious Cohorts
2009: George Barna's Seven Faith Tribes
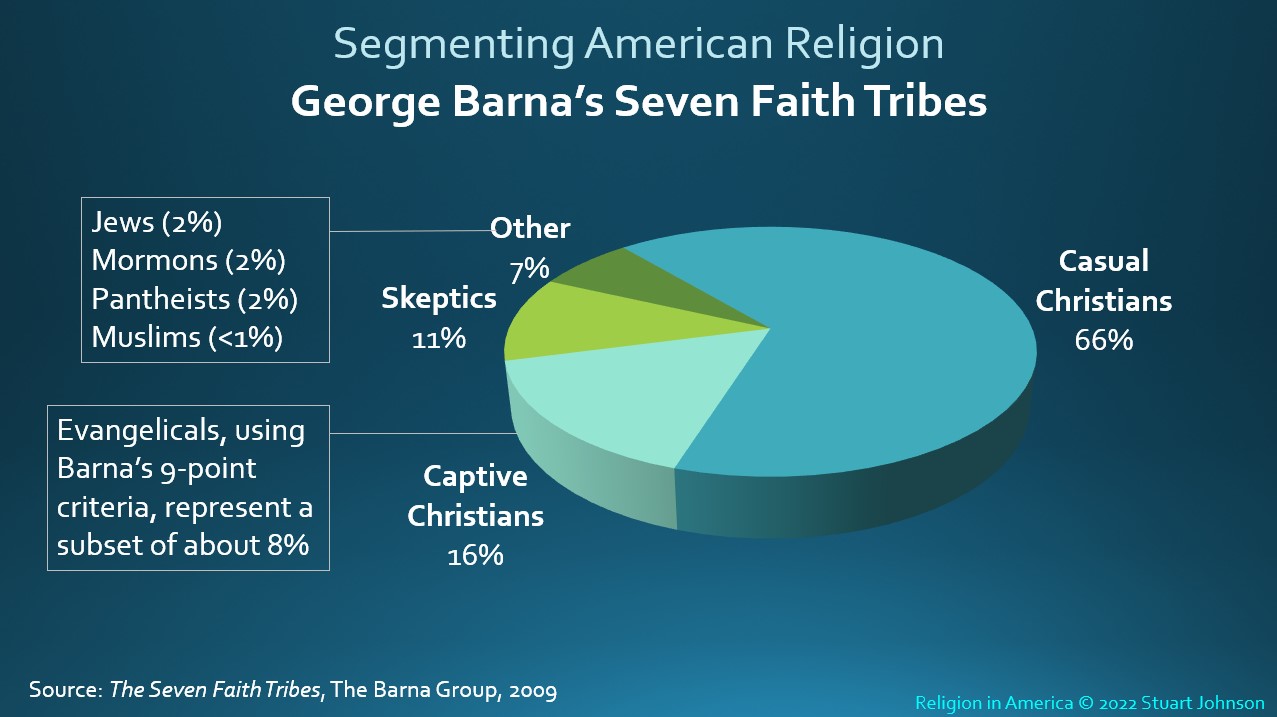
Casual Christians (66%) - Rather than allowing the Christian faith to shape their minds and hearts, Barna suggested, they have chosen to fit Christianity within the box they have created for it.
Captive-Christians (16%) - They see themselves first and foremost as spiritual beings. They believe their lives are to be lived out in the flesh, but for spiritual purposes and on the basis of biblical principles. [The name Captive Christians the name comes from the idea expressed by the Apostle Paul that he voluntarily took on the role of a slave of Jesus Christ.]
One quarter of the Skeptics adopt the label “deeply spiritual” (which is distinct from being religious). Nearly half of the adults in this tribe describe themselves as faith seekers who are unattached to an organized body of faith or theological perspective.[If these seekers represent the religious unaffiliated described by Pew, their significance has gone down dramatically since 2009.
2018: Pew Research Religious Typology
Research conducted extensive interviews using a battery of questions that covered a wide range of religious and non-religious behaviors and beliefs. Cluster analysis was used to look for significant groupings that represent the American adult population.
HIGHLY RELIGIOUS (39%) are represented by three subgroups:
- Sunday Stalwarts (17%) - Religious traditionalists actively involved with their faith and engaged in their congregation.
- God-and-Country Believers (12%) - Socially and politically conservative, most likely to view immigrants as hurting American culture.
- Diversely Devout (11%) - Traditionally religious, but majorities also believe in psychics, reincarnation, and that spiritual energy can be located in physical objects.
SOMEWHAT RELIGIOUS (32%) are represented by two subgroups:
- Relaxed Religious (17%) - Say it’s not necessary to believe in God to be a moral person. Religion is important to them, but few engage in traditional practices.
- Spiritually Awake (15%) - Few practice religion in traditional ways, but most believe in heaven and hell, and subscribe to New Age beliefs.
NON-RELIGIOUS (29%) are represented by two subgroups:
- Religious Resisters(12%) - Most think organized religion does more harm than good, politically liberal and Democratic.
- Solidly Secular (17%) - Hold virtually no religious beliefs and reject New Age beliefs.
Walking the talk
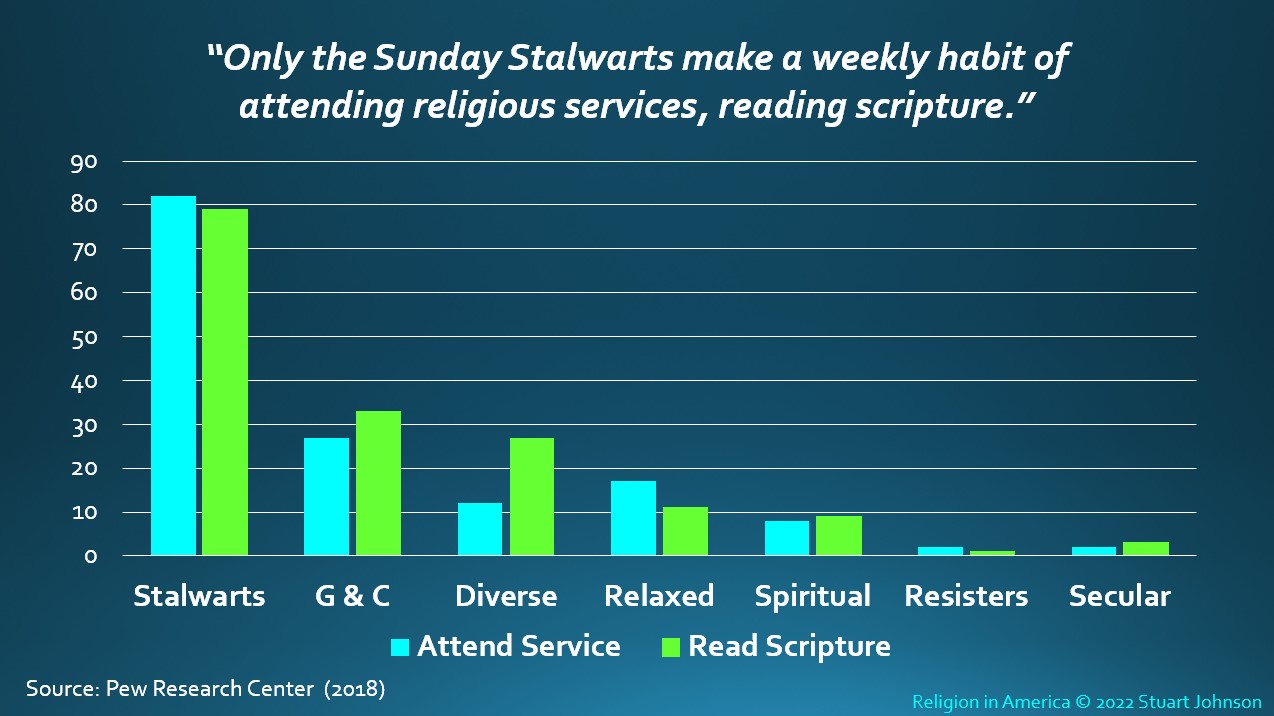
When asked about weekly habits of attending religious services and reading the Bible or other holy book, only the Sunday Stalwarts showed a high degree of connection between faith and practice (both in connection to organized religion and personal devotion).
One might expect God & Country Believers to be close behind, but they and all other groups fall off rapidly from this high degree of personal involvement.
It is interesting that the Sunday Stalwarts, at 17% in 2018 are remarkably close to Barna's Captive Christians, at 16% in 2009. This pattern is consistent with the observation of Ed Stetzer, president of Lifeway Research in 2013 when he reported on "The State of Evangelicalism":
[T]here is decline—in self-identified Protestants, primarily in mainline churches. Many who once identified themselves as nominal mainline Protestants now identify as nothing. The nominals have become the nones. As such, we see that Christianity isn't dying—cultural Christianity is. . . (emphasis added).
For Christians who take their faith seriously, it is not time to simply sigh and be thankful that the least-faithful are falling away. It is time, as never before, for reassessment, prayer and re-commitment to the mission Christ called his followers to:
"'You must love the Lord your God with all your heart, all your soul, and all your mind.' This is the first and greatest commandment. A second is equally important: 'Love your neighbor as yourself.'"
Jesus quoting The Great Commandments, Matthew 22:37-39 NLT
"Therefore, go and make disciples of all the nations, baptizing them in the name of the Father and the Son and the Holy Spirit. Teach these new disciples to obey all the commands I have given you. And be sure of this: I am with you always, even to the end of the age."
The Great Commission, Matthew 28:19-20 NLT
Which type are you? Take the Religious Typology quiz. (This is a short version of the much longer survey questionnaire, but produces a fair guesstimate of which cohort you would be identified with.)
Religion in America
Latest updates:
Update Conifence in Oranized Religion and Other American Institutions - August 31, 2022
Update charts and narrative in Summary for newest data - January 29, 2022
Add "Digging Deeper: Confidence, Part 2 - Timeline charts of responses for each of 15 institutions - August 25, 2021
Update "Digging Deeper: Confidence - incorporated 2021 data, additional details and analysis - July 29, 2021
Update "Confidence in Religion and Other American Institutions" section- July 22, 2021
Addition of "Digging Deeper" sections - June 28, 2021
About Religion in America. In 2012 Stu Johnson was the lead author of a report on the Religious Publishing Marketplace in America, produced by Simba Information for Zondervan/HarperCollins Christian Publishing. The chapter on Religion in America, a summary of survey research, some of it going back many decades, was compiled solely by Stu and subsequently extracted as a separate report.
About this page. The graphs on this page are selected slides from a more detailed PowerPoint® presentation that illustrates major trends in the American religious landscape. You can click on a graph to enlarge it. (It will open in a new tab.)
The primary data sources used include Gallup, Pew Research, and Barna Group. Data sources are shown on each chart. For some charts, the survey is repeated annually, others more sporadically, Each chart shows the latest data available at the time of the last update of this page.
Report Sections
(DD indicates more detail is available in one or more "Digging Deeper" pages):
• Executive Summary • The U.S. Compared to the World • The Changing Mix (DD) • Beliefs (DD) • The Importance and Influence of Religion in America (DD) • Confidence in Organized Religion and Other American Institutions (DD) • Defining Religious Cohorts
Executive Summary
Click on a Section header to go to that part of the report. Note beginning with "DD" describes a Digging Deeper page available for that section.
The U.S. Compared to the World
- In the U.S. the number of Christian adherents continues a decline that became noticeable around 1970 and is accelerating in the early decades of the 21st century. Those claiming Christian affiliation (Protestant, Catholic and non-denominational Christians) accounted for 93% of the adult population in 1964. It was 83% in 2000, then 68% in 2020. Meanwhile, those claiming no affiliation have been steadily climbing from 2% in 1964 to 21% in 2021 according to Gallup and 29% according to Pew.
- While Christian adherents are declining in the U.S., those who describe themselves as "born again" or "evangelical" remain relatively constant. Gallup starting asking the question in 1992, when 36% of adult respondents claimed to be born again or evangelical. The number peaked at 47% in 1998, then began moving down, ending at the low point of 34% in 2020, but rebounding to 36% in 2021, back to where it started in 1992.
The Changing Mix
DD on Composition of Religious Affiliation, with detailed demographics)
- Breaking the numbers down, it appears that most of the loss in Christian adherents is occurring among those who might be identified as "cultural" or "nominal" Christians, whose adherence has been driven by tradition more than personal belief and practice. This is clearly seen in the shrinkage of mainline denominations.
- The significant "rise of the nones" in the United States—those who claim no religious affiliation—has been accelerating since 2000 and is most noticeable among the youngest generations. A study in January 2018 by Barna, which includes 13-18 year-olds in Generation Z, shows a doubling of those identifying themselves as atheist (13%, compared to 6-7% for all older cohorts, including Millennial and Gen X). Where a sizable portion of early "nones" still retained an interest in spirituality, some have dubbed younger unaffiliated as the "rise of the Nones"—those who may have been involved with organized religion under the influence of family, but cut their ties completely in adulthood.
- Age Cohort, Political Party Preference and Geographic Region are the strongest indicators of variations in religious affiliation. In addition to the discussion of the Barna study of Generation Z later in this Summary, see Digging Deeper pages on Composition of Affiliates and Attendance at Religious Services for comparison with other demographic factors.
- Globally, Christian adherents represent the largest group, at 31%, followed by Muslim, Unaffiliated, Hindu, Buddhist, Other and Jewish. According to a 2018 Pew study,by 2050 Muslims will catch up with Christians as a proportion of world population, together claiming six in ten adults. The growth of unaffiliated will impact the U.S. more than the global population, according to the study.
Beliefs
DD on beliefs in God, the Devil, Angels, Heaven, and Hell
- Belief in God among Americans remains strong but showed signs of decline since the mid-1980s, paralleling but lagging behind the "rise of the nones," indicating the likelihood that belief in spiritual matters is distinct from affiliation with organized Christian religion. The expression of the belief has also been tempered by a softening of the survey question by broadening it from "do you believe in God" to "do you believe in God (or a Universal Spirit)?," which opens the door to a wider set of religious perspectives.
- Declining religious affiliation among younger age cohorts impacts beliefs about Science and the Bible, though an early study of Generation Z by Barna showed a possible break in that pattern among the newest age cohort.
- While nearly half of Americans believe the Bible is an "inspired Word," those who believe the Bible to be the "Actual Word" versus "Fables and Legends" have crossed paths in recent years, with the Fables and Legends view surpassing Actual Word in 2017, each camp represented by roughly one-quarter.
The Importance and Influence of Religion in America
DD on Attendance at Religious Services, with detailed demographics
- Those who believe religion is very important has dropped below the majority (48%) in 2020, falling 13% from its peak of 61% in 1998. There was a slight rebound in 2021 to 49%. On the other hand, those who see religion as not very important have slowly gained strength, beginning to compete with those who feel it is fairly important, a view that has remained more constant.
- Slightly more than half of Americans believe religion can answer today's problems, but the 41% divide with those who said No in 1994 narrowed to 11% in 2018, with a slight rebound since then, resulting in an 18% separation in 2021 (53% Yes, 35% No).
Confidence in Religion and Other American institutions
(DD on Confidence, additional tables and trend graphs by institution
- Americans have shown a steady erosion of confidence in major institutions—including organized religion— tracked by Gallup since 1973. (The confidence score is the combination of those responding "A great deal" and "Quite a lot").
In the 2020 report, issued in July during the early months of COVID-19, we saw a very uncharacteristic increase in confidence in two-thirds of the institutions.
In the update for July 2021 we saw a resumption of the overall decline in confidence. Gallup added Science as an institution, which came in at rank 3, pushing the other instiutions down by at least one ran from their 2020 order..
In the update for July 2022 ten of the sixteen institutions hit all-time low confidence scores. Scinnce did not return, but Large Tech remains in the survey for a third year.
- Organized religion was number 1 from 1973 through 1985. In 2020, it bounced up to 42% from a low of 36% in 2019. In 2021 Organized Religion lost almost all of its gain from 2020, and in 2022 it hit an all-time low of 31. Despite that, it increased two places in rank, to number 5, because Sciense did not return and The Presidency—which surpassed Organized Religion for the first time in 2021— fell 5 places in 2022.
Defining Religious Cohorts
- 2009: George Barna's Seven Faith Tribes - 66% Casual Christians, 16% Captive Christians, 11% Skeptics, 7% Other (Jews, Mormons, Pantheists, Muslims)
- 2018: Per Research Religious Typology - 39% Highly Religious (Sunday Stalwarts, God-and-Country Believers, Diversely Devout), 32% Somewhat Religious (Relaxed Religious, Spiritually Awake), 29% Non-religious
![]()
Look for the Digging deeper icon in sections below. It will lead to more detail on a particular topic, including demographic factors (gender, race, age cohort, geographic region, education, political party preference). This feature was introduced in June 2021 for four pages on Beliefs, Composition of Affiliates, Attendance at Religious Services, and Confidence in Institutions. Other Digging Deeper pages may follow as material becomes available.
The U.S. compared to the World
While Christian adherents have been declining, especially in the last two decades, the United States remains a predominantly Christian country—with 65% of adults identifying themselves as Christian in the most recent Pew polling. (Gallup shows 68%).
Around the world, according to various sources, Christians represented about half that level, with roughly three in ten of adults in 2020.
Pew suggests 28% unaffiliated in the U.S. in 2020, while Gallup puts it at 20%. The difference cannot be explained simply by margin of error, but by differences in survey methodology, question wording and interpretation of results. More on that as we dig deeper.
Though declining, Christian adherents are expected to dominate in the United States into the foreseeable future. By 2050 Pew predicts a drop from three-quarters to two-thirds of adults. In reality, we reached that level in 2018, according to Gallup and by 2020 it dropped to 65%.
Non-Christian religious adherents in the U.S. will increase some, but the most noticeable shift will be the continued increase of those with no stated affiliation. However, when looking at global projections, notice that Muslim adherents could match Christian by 2050. Most others, including unaffiliated, are seen as remaining the same or declining.
The Changing Mix
A 55-year trend
In many of the line charts in this report, orange dots represent low points on a line, yellow dots represent high points. There can be multiple dots for high and low points.
For much of the 20th century, Protestantism dominated the American religious landscape, with its adherents representing 70% or more of the adult population. Catholic adherents accounted for another one-quarter of adults, putting the combined total of Christian adherents well over 90% for many years.
Following World War II, Protestants and Other (non-Catholic) Christians declined from a steady 70% majority to just below 50% for the first time in 2012, according to Gallup. In 1998 Gallup began including "Other Christian" with Protestant. This reflects the rise of non-denominational churches as well as churches that do not promote their own affiliation with a denominational organization, so congregants may not know there is a denominational connection. Denominational Protestants fell below 50% of the population in 2006, while all Protestants hit that mark in 2012. Total Protestants fell to a low of 45% in 2019, but came back to 46% in 2020, then dropped back to 45% in 2021. While it is close enough to be within the margin of error, it is interesting that 2020 was the year that the COVID-19 pandemic swept around the world and the year of another contentious presidential election in the United States with its sometimes strange amalgam of religion and politics. We will see stronger examples in other charts below.
Catholics have held steadier, at roughly a quarter of the adult population, but show a steady decline from a peak of 29% in 1982 to a low of 21% in 2019, followed by a slight bump up to 22% in 2020 that continued into 2021. Meanwhile, those the no stated religious preference, have climbed steadily from nearly invisible through the 1960 to a course destined to surpass Catholics by 2018.
The rapid and nearly steady ascent of the "Nones" that began around 2000 plateaued over the last five surveys, hitting a high (for Gallup) of 21% in 2019, falling back to 20% in 2020, then back to 21% in 2021. Pew Research puts the non-affiliated closer to 30%, part of which I believe has to do with the way each survey causes people to interpret their connection with a religious tradition. Even with the less extreme picture painted by Gallup, it is clear that the way in which Americans identify their connection with religion—notably among the historically dominant Protestant majority—has undergone a huge seismic shift since 1970.
Initially, the increase in unaffiliated (commonly called "the rise of the nones") reflected a rejection of organized religion, with some "nones" remaining spiritually open. More recently, however, especially among younger generations, we are seeing growth in those who identify as agnostic or atheist. (See the charts on Generation Z below).
Since 1992, Gallup has asked people if they describe themselves as "born again" or "evangelical." As a self-description there is plenty of latitude and I believe the term "evangelical" was co-opted by the mainstream media in political analysis beginning around the 2000 presidential election, applied to what in the 1990's was called the Religious Right. That designation was represented by Jerry Falwell's Moral Majority and similar movements growing out the Fundamentalist stream of American Protestantism. Regardless, the shifting, even distorted, definition of evangelical would not impact Gallup's question because it includes the broader umbrella of born again.
George Barna developed a strict definition of evangelical, based on beliefs and behaviors, which narrows the group down to about 8% of the American adult population. Beyond those who fit this narrow definition, a third or more in Barna surveys have described themselves as "born again."
During the early 2000's, I was involved in research for Tyndale Publishing House during the height of the popularity of the Left Behind end-times series. During that time, Tyndale commissioned research, part of which indicated that Catholics compromised a good part of the audience for that series and many of them used "born again" to describe themselves. Therefore, while "evangelical" generally refers to a subset within Protestantism, those who identify themselves as "born again" can be found across Christian adherents.
Needless to say, it is interesting to note the rise of this group from the start of the question in 1992 at 36% of all respondents) to a high of 47% in 1998. From there, the trend has been slowly downward, but the low of 34% in 2020 is barely below the starting point back nearly 30 years ago, which was matched again in 2021. (The downward deflection in 2020, while very small, is opposite the minor upward deflection seen in the charts above related to self-identified affiliation. We have to be careful, however, in trying to find significance in changes of a point or two that fall within the margin of error.)
Compared to other indicators with far more significant change, the trend here is remarkably level. In fact, the proportion of self-proclaimed born-again/evangelicals among Christian adherents (including Catholics), at 52% in 2020, has actually grown, from 44% in 1992 to 54% in 2021. This could be attributed to the idea expressed by Ed Stetzer and others that "the rise of the nones" actually represents a winnowing out of nominal Christians for whom faith was more form and tradition than substance.
Addendum (added February 5, 2022)
It might be assumed that the relative constancy of this cohort must represent considerable cohesion among those who claim to identify as born again or evangelical. That may have been more true when Jimmy Carter talked about his "born again" experience, but it was at the time of the 2000 election that the Red-Blue divide began to literally color political discussion with increasing intensity—including the role of "evangelicals" on the red side of the divide.
While "evangelical" is a word with a long history, the tradition of evangelicalism that I came to know, which rose to prominence after World War II, attempted to distinguish itself from mainline denominations on the left and Fundamentalism on the right. In my understanding, that brand of evangelicalism was intended to engage the culture while recognizing the authority of the Bible.
By the 1990s the growth of television evangelists from the fundamentalist side (Pat Robertson and Jerry Falwell among others) gained enough exposure to acquire considerable political power. Especially after the 2000 election, the major media began to drop the "Religious Right" label and conflate the differences between the movements to the single label "evangelical" which made it easier for the broader culture to view all conservative Christians as one cohort.
If viewed primarily as a political movement, how can such "evangelicals" engage the culture in the tasks that Christ set out for his church when he emphasized the two greatest commandments, to love God and love your neighbor? These parallel the words of Micah in the Old Testament to act justly, love mercy, and walk humbly.
Added to the drift toward political power, the fallout from the 2020 election and the COVID-19 pandemic saw an alignment of "evangelicals" in the public mind (through the lens of traditional and social media) with conspiracy theories and misinformation about election fraud and the pandemic. Piling on even more, from the center of "genuine" evangelicalism came a wave of scandal, with prominent leaders and churchers involved in financial misdeeds, abuse of power and moral failure. For a good discussion of what has happened, see David Brook's February 3, 2022 opinion piece in the New York Times "The Dissenters Trying to Save Evangelicalism from Itself."
All of this has produced consideable angst and an identity crisis for many in the evangelical center. Some of my acquantances, being disturbed and embarrased by it all, no longer feel they can call themselves evangelical.
It reminds me of the times in the Baptist church we attended when we considered changing the name because "Baptist" was thoght to have acquired negative connotations, yet we resisted because Baptists in general (being such a diverse movement today) have such a rich, positive history, including their role in America defining the religious liberty embraced in the First Amendment of our Constitution. In a similar way, how will Gallup's question "would you descirbe yourself as 'born again' or evangelical?" play out in the future? Only time will tell.
The changing mix: Other religions
The data comes from different sources. Because the numbers are small (within the error of margin for most surveys), we can only make a few general observations.
Clearly, there has been some increase in Other religions, yet they still represent a very small portion of the adult population in the U.S., growing most notably between 1990 and 2007, then varying one or two percent since then. (1% is still 3.3-million people out of a population of 332-million.)
Jews have remained between one and two percent in surveys since 1990.
Muslim adherents remain a smaller segment than many people might assume, given exposure in news and politics (and confusion between religion, ethnic background, and national origin). The growth shown by 2010 seems to have settled back to just under two percent.
Adherents of Other non-Christian religions (which represent many groups) are growing, up three-fold since 1990, and greater than the combined total of Jews and Muslims.
None does not equal Atheist, but does mean young
Prior to 2018, a breakdown of those who claimed no religious affiliation showed some growth of those who identify themselves as Atheist and Agnostic, but the greatest growth was among those who simply have no preference. (Compare this chart with the earlier one showing Gallup results, which shows unaffiliated ("None") about 5-8 percentage points below Pew throughout the time covered here).
From 2008 through 2016 Pew divided unaffiliated ("nothing in particular" in this chart) into Secular and Religious Unaffiliated. Starting with a nearly even split in 2008 (close to 6% each), by 2016 the gap widened to 14% Secular and 3% Religious. The distinction has faded to the point that Pew no longer asks about it.
The presence of the seemingly paradoxical "Religious Unaffiliated" is an indicator of the discomfort that a number have had with organized religion, especially as the rise of the Nones began to explode. In 2008, Pew found that when Unaffiliated were asked a number of questions about spiritual issues, they could be divided between Religious—those who claim that spiritual factors are important to them—and Secular—those who claim little or no importance for spiritual things.
It appears that those with spiritual interest began to decline, so the most recent division between Atheist, Agnostic, and Nothing in Particular shows how significant has been the move away from organized religion and religious belief, especially in the second decade of the 21st century.
As shown in the chart, Pew reported "Nothing in Particular"
at a high of 20% in 2021, up noticeably from five years at 16% (2014 through 2018), while the Atheist/Agnostic split has remained 4% and 5% since 2017.
An increasing generation gap
When viewed by generation, it is striking to note the accelerating growth of the unaffiliated with each succeeding generation. The proportion moves from 10-percent or less unaffiliated for those born before the end of World War II in 1945, to more than a third of the youngest generation.
Note that Pew shows unaffiliated Millenials in 2018 ten-percent above a similar breakdown by Barna in the next chart. In the other age cohorts, Barna shows higher unaffiliateds than Pew by a smaller margin. The lesson here is that survey research is most useful to show trends over time than a high degree of precision at any one time. As already pointed out, this is often due to differences in research methodology and how questions are framed and interpreted.
Meet Generation Z
In a study released in January 2018, Barna Group revealed a startling indicator of the depth of age-related disconnect with organized religion.
The youngest age cohort, known as Generation Z, or Gen Z, shows a 5-point increase over Millenials in not claiming a religious affiliation. Most significant: all of the increase and more came from those claiming to be atheists.
The Barna report reveals much more detail, which was the subject of an InfoMatters blog, "Generation Z," posted in February, 2018.
Beliefs
Belief in God
The trend indicated by this chart, developing since 2000, is very obvious (and corresponds to the "rise of the nones" discussed throughout this report). This is the longest-running of the Gallup questions on religion, going back to 1945. As you can see, belief in God was nearly unanimous from the end of World War II to the last decade of the 20th century. Since then, it has begun to erode noticeably. When first asked, the question referred only to "God," but in more recent years it has referred to "God or a Universal Spirit."
Science and the Bible
The Gen Z study asked about respondents' views of science and the Bible. In general, younger generations side with science or view science and the Bible as independent, expressing different aspects of reality. A diminishing proportion see the Bible and science as complementary, while the number who side with the Bible when there is apparent conflict increases with the youngest generations.
This may seem counter-intuitive, but could be due to the strong influence among some home schoolers and Christian academies, "young earth" groups and others taking exception with scientific assumptions about the origins of life and the age of the earth.
Beliefs about the Bible
An interesting parallel to the Science and the Bible chart above is data from Gallup on views of the Bible.
What I find striking is that those who perceive the Bible as the inspired word of God have remained fairly steady since 1976. On the other hand, those who take a more literal view have declined by 12%. While it does not represent the movement of individuals, the decline is not matched by a growth in Inspired, but rather by an 11% increase in those viewing the Bible as Fables & Legends. The two lines converged in the latest survey in 2017. Unfortunately, the survey has not been done again, which would likely show those two lines continuing to move further apart, in opposite directions. [Unlike other charts, which represent annual surveys, the colored dots show the value in years the survey was conducted, with the solid lines showing the overall trend.]
![]()
See more details about BELIEFS
(God, Devil, Angels, Heaven, Hell)
The Importance and Influence of Religion in America
How important is religion in your life?
Both "very important" and "fairly important" show declines over 25 years. "Very important" is off 12% from the peak of 61% in 1998 and 2003, up slightly in 2021 after hitting a low of 48% in 2020.
"Fairly important" fell 7% from its starting point of 29% in 1992 to its low of 22% in 2016. From there it has rebounded slightly, ending at 27% in 2021.
"Not very important" moved up sd much as 15% in nearly three decades, crossing the slowly declining "fairly important" line in 2016, matching it in 2019, rising to 27% in 2020, but dropping again to 25% in 2021 as the two lines look like twisted ropes in the last three years (remember, however that this could easily be within the margin of error for such research). This growth exceeds the "rise of the nones" in the same time period, which went up 10% (some earlier converts to none could have shifted from religious to secular unaffiliated).
Ability of religion to address today's problems
The decline for "yes" is greater than that of personal importance on the previous chart—a decline of 18% since the peak of 67% in 1999. However, Yes moved up 4% in 2019 to 53% and stayed there into 2020. (This question was not updated for 2021)
Those who felt that religion "is largely old-fashioned and out of date" ("No" on the chart) rose fairly steadily by 17 points, from 21% in 1994 to 38% in 2018. As with Yes, it reversed course in the next two years, ending at 35% in 2020—a likely temporary change of direction in the overall steady climb. What is interesting is that the low for Yes and the high for No both appeared in 2018, with the change of direction occurring before COVID and other events of 2020. Over the next few years, that may level off into a blip in time. How long now before the No's outnumber the Yes's?
The influence of religion
Here, the change is much more dramatic, with a combination of a general trends and two marked reversals that coincided with the September 11 terrorist attacks on America in 2001 and the first year of the COVID-19 global pandemic in 2020. "Losing" is a mirror image of "Increasing," and since it dominates, let's look at the overall trend. From 1992 through 1998, "losing" was trending down (meaning "increasing" was rising). The influence of religion seemed to rebound a bt in 1999 and 2000 (a new millennium, along with the election of George W. Bush and what I have observed as the increased partisanship with media focused on red and blue states, along with lumping Fundamentalist and Evangelical branches of Protestantism under the "evangelical" label).
Then came September 11. Since the Gallup poll is updated in November, it would have had a strong influence on survey responses that year, which showed a sharp reversal, with increasing jumping to a high of 55% while losing hit its low of 39%. The trend reversed again for two years, then like a winging pendulum reversed again until the two opinions met at just under 50% for two years (2004-05). From there, coinciding with one of the most noticeable periods in the "rise of the nones," losing kept moving up to a high of 79% in
2019, while increasing descended to a low of 19%.
Then came COVID-19 and the contentious Presidential Election of 2020. With a response similar to September 11, the lines radically reversed, with Losing dropping 15 points to 54% and Increasing bouncing up 14 points to 33%.
Was it COVID or the 2020 presidential election? The election itself, and the controversy over Donald Trump's claims of a stolen election following his loss would not have occurred until after the survey was conducted, but the climate of the election campaign, with much coverage of the influence of "evangelicals" as Trump supporters could have been a bigger factor than COVID itself (lockdowns created much political reaction and the vaccines were still months away).
That reversal collapsed nearly completely in 2021, though COVID continued and by the time Gallup would have conduced its survey respondents would have been aware of early success of vaccines which was then dampened by the delta variant to which the unvaccinated (many popularly identified as "evangelical Christians") were vulnerable, followed by the omicron variant which was emerging as the survey was conducted. This combined with reaction to ongoing controversy over the 2020 election and the January 6, 2022 attack on the U.S. Capitol by Trump supporters, could help explain why 2020 looks like a dramatic but isolated interruption to the long-term trend of religion losing its influence.
Membership and attendance
Membership has fallen faster than attendance, pointing out that the importance of membership (which requires a formal process in most religious bodies) has itself been in decline. Some are content to attend without being official members. Furthermore, while many churches may still distinguish between members and attenders, it is unclear whether respondents make that distinction. This is true not just of religion, where membership is usually distinct from attendance, but across the spectrum of organizations in society that are dependent on membership (service clubs, scouting, etc.) .
At any rate, while it is clear that immediacy of attendance (in the last seven days) remains lower than having a sense of belonging, attendance has declined by less than half (11%) that of membership (23%) since 1992. The significance of the comparison in the chart is that membership does not matter nearly as much as it once did, at least as reported by individuals (as Gallup is doing). Attendance is a much more powerful indicator of the influence of religion in America, with frequent attenders (once a week) a shrinking minority since 1992. The charts in the Digging Deeper section provide additional (and perhaps surprising) insights into the demographics of attendance.
![]()
See more details about ATTENDANCE
(gender, race, party preference and more)
Confidence in Religion and Other American Institutions
This section was last updated August 31, 2022, following release of the results of the 2022 Gallup survey on institutional confidence.
Gallup began its annual survey of confidence in American institutions in 1973. The question is stated "Now I am going to read you a list of institutions in American society. Please tell me how much confidence you, yourself, have in each one -- a great deal, quite a lot, some, very little, or none?" The score in the charts and referred to as being confident represents those who responded "a great deal" or "quite a lot."
Survey results are released each July, so results may reflect events in the first two quarters of a given year as noted below.. It is also important to point out that the results of any public opinion survey have a margin of error determined by sample size and methods of selecting participants, For this Gallup survey, the margin of error is typically 4- to 5-percent. Taken together, these factors indicate why trends over time are more significant than relatively small changes from year to year.
In 1973, the first year Gallup conducted its annual measure of confidence in major institutions, "the church or organized religion" was rated the highest among 15 institutions, 21 points higher than the average for all 15 (and clearly above the margin of error). Over the decades since then, however, overall confidence has steadily fallen, with Organized Religion declining at a more rapid pace than the others combined—to the point that Organized Religion in 2022 is only one point higher than all institutions surveyed (though that is within the margin of error, which is ±1.5 points at that level ).
Organized Religion continued to rank first through 1985, then fell below 60%. Among the reasons: Televangelist scandals, child molestation by priests; then a general decline in religiosity continued the downward trend (as scandals in Catholic and Protestant churches continued). Organized Religion dropped 32% from its high of 68% in 1975 to 36% in 2019). In 2020, the survey reflected the early months of COVID with many congregations under lockdowns and scrambling to stay connected through various online options, Organized Religion rebounded to 42% in 2020, but settled back to 37% in 2021 even as many congregations were opening up. In 2022 Organized Religion hit an all-time low of 31%—bringing the total decline from high to low to 37-points, down to less than half of where it started.
At the same time that Organized Religion has been racing to the bottom, confidence for all institutions in the survey has fallen 18% from a high of 48% in 1979 to its new low of 30% in 2022. There was a noticeable upturn in 2020 across two-thirds of the 15 institutions, most likely attributable to positive attitudes toward the responses of those institutions to the COVID-19 pandemic., A counterpoint, however, was the downturn for Police and TV News, with George Floyd's death at the hands of police in Minneapolis occurring shortly before the survey results were released in July.
While 10 of the 16 institutions have had 50% or more confidence at some point since their inclusion in the survey, only two can make that claim now. In 2022 all 16 institutions declined in confidence from 2021 and ten of the sixteen hit all-time lows.
There have been numerous ups and downs in confidence across institutions throughout the 50-year history of the survey. What we can see in the past three years is worth noting. In 2020, with the survey taken in the early months of the COVID pandemic, confidence in several institutions increased significantly in what appeared to be an expression of empathy for the people in those institutions affected by lockdowns and restrictions imposed by efforts to cope with the virus. The "COVID bump" was just that however, as things began to turn downward in 2021 and accelerated into 2022, with all institutions down and 10 of them at their all-time lows.
An interesting side note for 2022 is what I see as a "ripple effect" in responses that keeps the Overall Confidence (including Some) in a majority
for all but the lowest ranking institutions. For most of the institutions in 2022, the downward drop in Confidence Score is a result of Great Deal going down, while Quite a Lot remains close to or at 2021 levels. The downturn in Great Deal ripples down to an increase in Some, thus keeping Overall Confidence close to 2021 levels. I see this as a growing "lukewarm" sense of confidence with the majority of the institutions in the Gallup survey. Only the lowest begin to move into majorly Very Little or None. This is reflected somewhat in what follows, but you can find much more detail in the "Digging Deeper" links at the bottom of the page.
In 2021, Science was added as the 17th institution, taking third place, pushing the rest of the list down at least one place from their 2020 rankings. Science was dropped in 2022 (I commented last year that I did not think it would last because "science" is not like the other institutions which can be associated with specific organizations. Large Tech was added in 2020 and remains in the list—it can be identified with companies that rival government in power: Amazon, Apple, Facebook, Google, Microsoft and Twitter, among others, all of them part of yet distinct from Big Business, so worthy of their own status as an institution. .
Looking at the 2022 results, Small Business and The Military stayed in the top two spots, but each were down in score from 2020 when Small Business hit its high. In fact, all 16 institutions are down in score from 2021. Because of the presence of Science last year, 12 of the institutions rose in rank despite declining confidence (8 would have simply stayed in place compared to last year were it not for the one year appearance of Science at number 3. Falling in rank were the Supreme Court, down 11 points and two ranks to Number 10, and The Presidency, down 15 points and six ranks to Number 11 (it was only institution to move up in rank last year). .
Organized Religion lost all of its 2020 bounce, coming in at an all-time low of 31 for 2022. It did manage to move up two ranks, due to the one-year tenure of Science at number 3 last year and the fall of The Presidency to an even-lower score and ranking (most years it was behind Organized Religion, but last year was just ahead of it by rank).
Despite all the media coverage that might lead you to assume a stampede in the other direction, The Police recouped third place from Science, which did not return in this year's survey. It did drop six points, establishing a new all-time low at 45 (the highest of the new lows this year).
Including "Some" confidence in the score would bring a number of the weakening institutions above 50%, but that is only stretching things to reach levels once achieved by "A Great Deal" and "Quite a Lot." An analysis in the Digging Deeper section will show trend charts for individual institutions that makes the distribution by response over time more clear.
Spanning more than 20 points between their high and low scores are 13 of the 16 institutions for 2022 (last year there were 10). Six hit their low in 2022, Criminal Justice hit it in both 1993 and 2022. Five never had majority confidence (over 50): Congress, TV News, Criminal Justice System, Big Business and Organized Labor.
- The Presidency - 49 points between its high of 72 in 1991 and low of 23 in 2022 - median score: 39 - 23 now
- Banks - 39 points between its high of 60 in 1979 and low of 21 in 2012 - median score: 41 - 27 now
- Organized Religion - 37 points between its high of 68 in 1975 and low of 31 in 2022 - median score: 56 - 31 now
- Public Schools - 36 points between its high of 62 in 1975 and low of 26 in 2014 - median score: 39 - 28 now
- Congress - 35 points between its high of 41 in 1973 and low of 7 in 2022 - median score: 24 - 7 now
- The Military- 35 points between it high of 85 in 1991 and low of 50 in 1981 - median score: 66 - 64 now
- Newspapers - 35 points between its high of 51 in 1979 and low of 16 in 2022 - median score: 33 - 16 now
- TV News - 35 points between its high of 46 in 1993 and low of 11 in 2022 - median score: 26 - 11 now
- The Supreme Court - 31 points between its high of 56 in 1985 & 1988 and low of 25 in 2022 - median score: 45 - 25 now
- The Medical System- 20 points between its high of 51 in 2020 and low of 31 in 2007 - median score: 39 - 38 now
- Organized Labor - 20 points between its high of 39 in 1971 and low of 19 in 2007 & 09- median score: 26 - 28 now
- Criminal Justice System - 20 points between its high of 34 in 2004 and low of 14 in 1993 & 2022 - median score; 24 - 14 now
- Big Business - 20 points between its high of 34 in 1975 and low of 14 in 2022 - median score: 24 - 14 now
What does the overall decline of confidence say about the future of our society when we have so little trust in our bedrock institutions? What can the Christian church (and other faith communities) do at the individual and local level to restore trust when organized religion itself has fallen so far?
![]()
See more details about CONFIDENCE IN MAJOR AMERICAN INSTITUTIONS
Part 1: Trends, Comparison to Medians/Highs, Including "Some", Breakdown of Historic Highs/Lows
Part 2: Demographic breakdown of responses for each institution
Part 3: Trendlines of responses for each institution
Part 1 was last updated August 31, 2022, Part 2 was added September 9, 2021 and Part 3 was updated September 14, 2022.
The next annual updates should be posted in August 2023.
Defining Religious Cohorts
2009: George Barna's Seven Faith Tribes
Casual Christians (66%) - Rather than allowing the Christian faith to shape their minds and hearts, Barna suggested, they have chosen to fit Christianity within the box they have created for it.
Captive-Christians (16%) - They see themselves first and foremost as spiritual beings. They believe their lives are to be lived out in the flesh, but for spiritual purposes and on the basis of biblical principles. [The name Captive Christians the name comes from the idea expressed by the Apostle Paul that he voluntarily took on the role of a slave of Jesus Christ.]
One quarter of the Skeptics adopt the label “deeply spiritual” (which is distinct from being religious). Nearly half of the adults in this tribe describe themselves as faith seekers who are unattached to an organized body of faith or theological perspective.[If these seekers represent the religious unaffiliated described by Pew, their significance has gone down dramatically since 2009.
2018: Pew Research Religious Typology
Research conducted extensive interviews using a battery of questions that covered a wide range of religious and non-religious behaviors and beliefs. Cluster analysis was used to look for significant groupings that represent the American adult population.
HIGHLY RELIGIOUS (39%) are represented by three subgroups:
- Sunday Stalwarts (17%) - Religious traditionalists actively involved with their faith and engaged in their congregation.
- God-and-Country Believers (12%) - Socially and politically conservative, most likely to view immigrants as hurting American culture.
- Diversely Devout (11%) - Traditionally religious, but majorities also believe in psychics, reincarnation, and that spiritual energy can be located in physical objects.
SOMEWHAT RELIGIOUS (32%) are represented by two subgroups:
- Relaxed Religious (17%) - Say it’s not necessary to believe in God to be a moral person. Religion is important to them, but few engage in traditional practices.
- Spiritually Awake (15%) - Few practice religion in traditional ways, but most believe in heaven and hell, and subscribe to New Age beliefs.
NON-RELIGIOUS (29%) are represented by two subgroups:
- Religious Resisters(12%) - Most think organized religion does more harm than good, politically liberal and Democratic.
- Solidly Secular (17%) - Hold virtually no religious beliefs and reject New Age beliefs.
Walking the talk
When asked about weekly habits of attending religious services and reading the Bible or other holy book, only the Sunday Stalwarts showed a high degree of connection between faith and practice (both in connection to organized religion and personal devotion).
One might expect God & Country Believers to be close behind, but they and all other groups fall off rapidly from this high degree of personal involvement.
It is interesting that the Sunday Stalwarts, at 17% in 2018 are remarkably close to Barna's Captive Christians, at 16% in 2009. This pattern is consistent with the observation of Ed Stetzer, president of Lifeway Research in 2013 when he reported on "The State of Evangelicalism":
[T]here is decline—in self-identified Protestants, primarily in mainline churches. Many who once identified themselves as nominal mainline Protestants now identify as nothing. The nominals have become the nones. As such, we see that Christianity isn't dying—cultural Christianity is. . . (emphasis added).
For Christians who take their faith seriously, it is not time to simply sigh and be thankful that the least-faithful are falling away. It is time, as never before, for reassessment, prayer and re-commitment to the mission Christ called his followers to:
"'You must love the Lord your God with all your heart, all your soul, and all your mind.' This is the first and greatest commandment. A second is equally important: 'Love your neighbor as yourself.'"
Jesus quoting The Great Commandments, Matthew 22:37-39 NLT
"Therefore, go and make disciples of all the nations, baptizing them in the name of the Father and the Son and the Holy Spirit. Teach these new disciples to obey all the commands I have given you. And be sure of this: I am with you always, even to the end of the age."
The Great Commission, Matthew 28:19-20 NLT
Which type are you? Take the Religious Typology quiz. (This is a short version of the much longer survey questionnaire, but produces a fair guesstimate of which cohort you would be identified with.)