
Making Information Make Sense
Religion in America
Digging Deeper: Confidence Part 2 - Demographics
This page was added September 9, 2022
Part 1 —Overview: 2022 Trends, impact of "Some" responses, breakdown of responses for historic Highs and Lows
Part 3—Historic timeline charts tracking survey results for each institution
< back to Religion in America summary
Summary
The following charts provide an anlysis of the demographic breakdown provided by Gallup for f the 16 institution covered it ins 2022 survey of Confidence in American Institutions.
When looking at charts, remember that the Gallup confidence survey is released in July, so it actually reflects responses in the second quarter of the year. This is especially important when considering elections and significant events, such as September 11 that would have occurred later that calendar year.
Survey Profile

The chart above shows weighted distributions, where small adjustments are made to make the distribution of resopndents more closely fit the general adult population. Even as survey research become more difficult in the age of cell phones and the internet, Gallup's research methods have remained solid and weighting is minimal compated to other survesy I have seen where the sample if wildly out of line with the population. The sample size and selection processused by Gallup produce a margin of error of about 5%.
Notice that none of the demographic categories is split into more than three cohorts. The sample size would have to increase significantly to allow further divisions while maintaining acceptable accuracy.
You will see some differenes attributable to other factos, but generally speaking Party ID and Ideology is where you will see the gretest differences in confidence.
While there is considrable redunancy between Party ID and Ideology, you will see in the details that follow how they sometimes track very closely and other times show divergence between ideology and part.y. .
The Details
The following charts are sorted by 2022 Confidence Score (Great Deal + Quite a Lot responses). Reference to Overall Confidence includes "Some" responses. Some institutions have shown a decline in Confidence Score, while the Overall Confidence has remained more stable. The "Trend" indicated in the details of each is my own assessment to characterize each institution.
Browse the page, or click on a thumbnail image here to select an institution. Clicking on a timeline chart will open an enlarged version in another tab or window. Close it to return here.
 Big Business
Rank 1 2022: Small Business
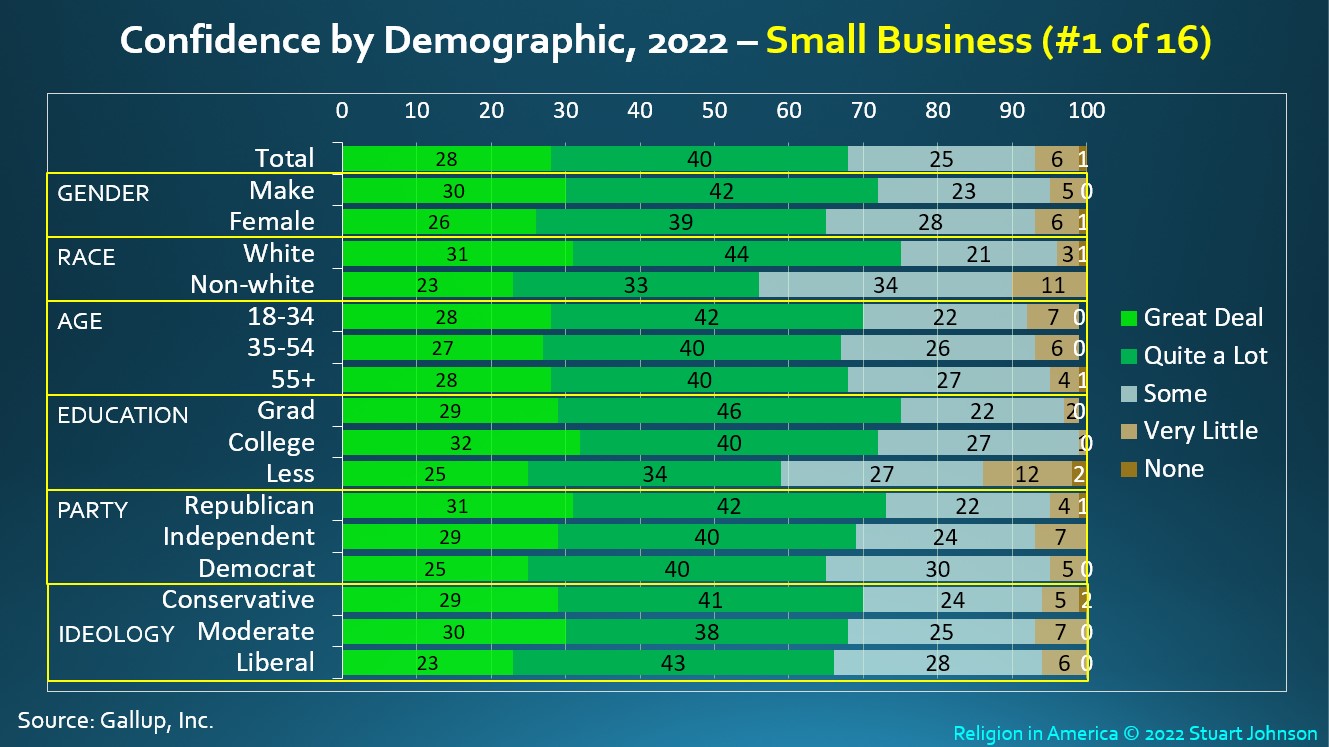
More than two-thirds of respondents (68%) expressed confidence in Small Business (Great Deal or Quite a Lot). Still very strong, it is down from a high of 75% in 2020 in the early days of the COVID pandemic, when many businesses were impacted by strict lockdowns, arousing public sentiment. Small Busienss was added to the Gallup survey of instituionl confidence in 2007, so it is relatively new, with others going back to 1973.
While all cohorts showed solid majority confidence in 2022, non-whites and those with less than a college education expressed somewhat lower, though still majority, confidence.
Rank 2 2021: The Military
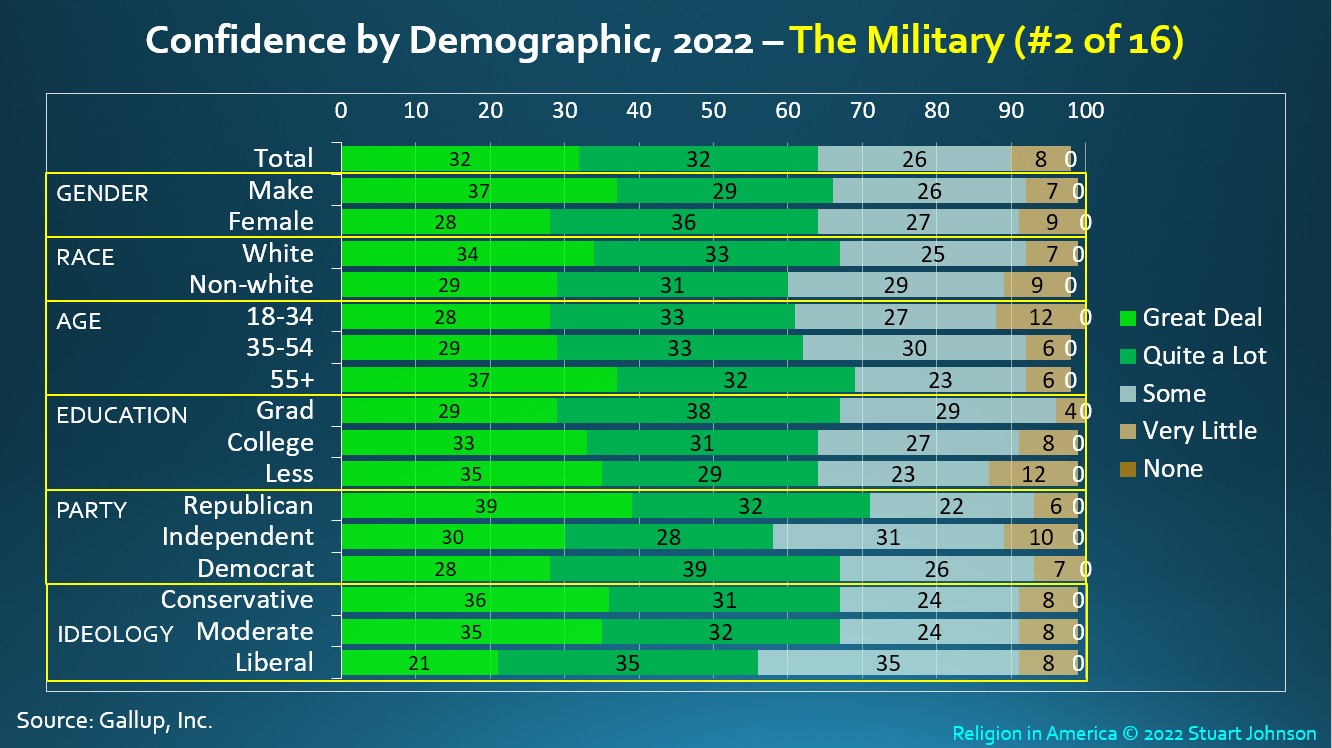
As with Small Business, a solid majority of nearly two-thirds (64%) expressed confidence in The Military.
While variation are not highly signfiicant (remember, the margin of error is about 5%), by a relatively small margin support for The Military was strogest among whites, those 55 years of age and older, and Republicans. By party ID while Independents still showed majority confidence, it was weaker than either Republicans or Democracts (Republicans did have the strongest Great Deal response of all demographic cohorts). By ideology, Liberals also had majority but weaker confidence than conservatives or moderates, who came out with nearly identical scores across the responses.
Rank 3 2022: The Police
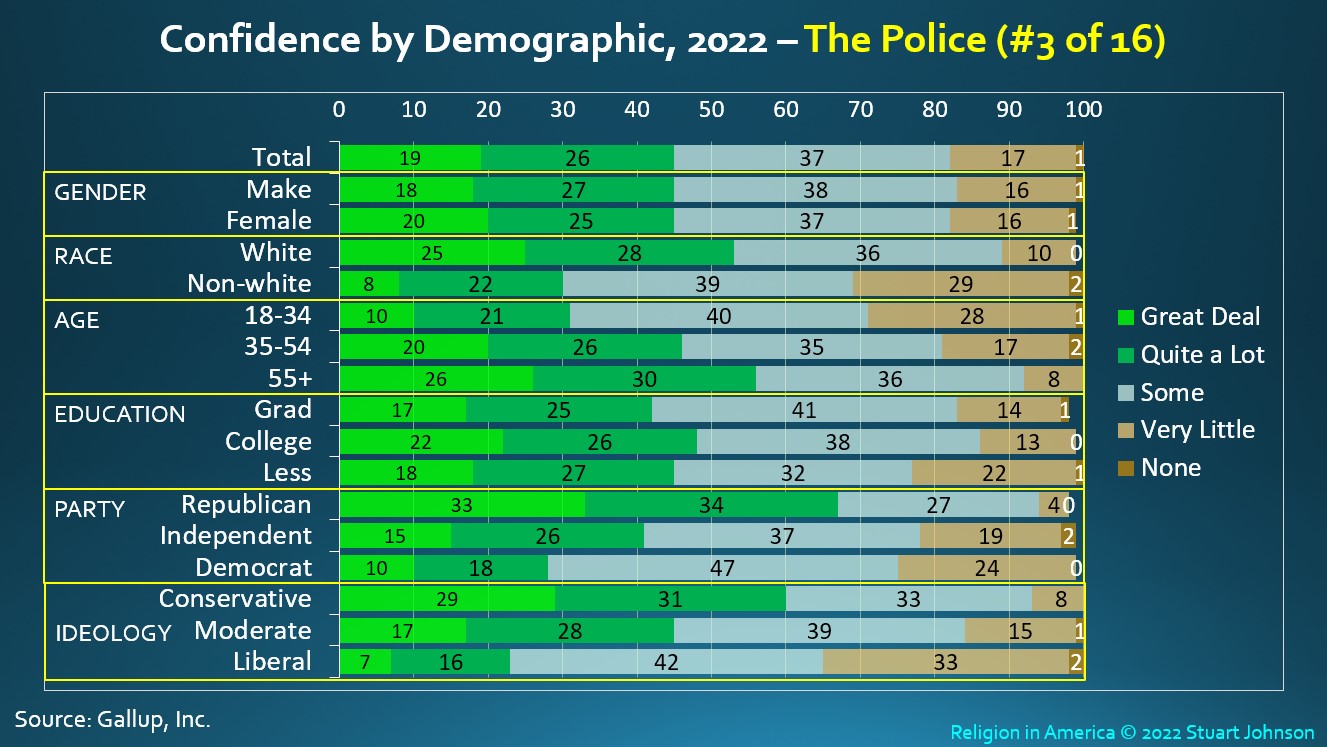
Confidence in The Police dropped below a bare majority (51%)in 2022, to 45%, down from its high of 64% in 2004. The Police as an institution was introduced to the Gallup survey in 1993.
Reflecting the social unrest surrounding relationships between the police and communities, seen in the demonstrations and riots across the natioan in summer of 2020 following the death of George Floyd at the hands of Minneapolis police, demograpic responses overall remain quite varied:
- Gender: little difference between men and women
- Race: Whites much higher confidence than non-whites. most notaby with Great Deal three times that of non-whites (25% vs. 8%), while Quite a Lot and Some were actually fairly close.
- Age: Confidence in The Police increases with age, though 71% of those 18-34 years old had at least Some confidence.
- Education: not a major factor, with all categories fairly close to the Total distribution
- Party ID showed the greatest difference, with Republicans showing the highest Score of all cohorts (67% against only 28% for Democrats), though both Independents and Democrats had majority confidence when including Some
- Ideology followed a similar pattern to party ID, with 60% of Conserevaties and only 23% of :Liberals expressing high confidence. Once again, however, even Liberals showed 2/3 confidence (65%) when including Some, while 1/3 (33%) expressed Very Little confidence in The Police.
Rank 4 2022: The Medical System
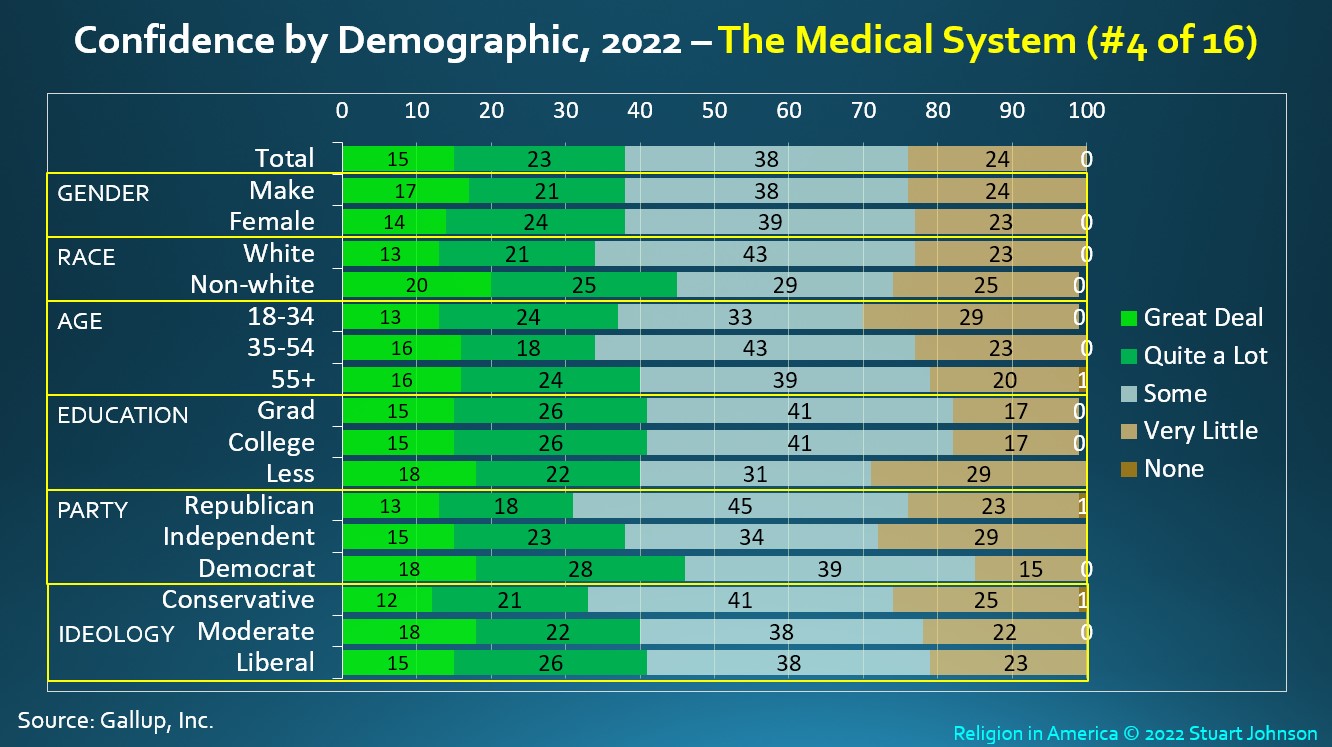
The Medical System dropped to 38% Confidence in 2022, follwoing a high of 51% in 2020. If you look at the Timeline chart for The Medical System in Part 3 you will see that responses have been fairly consistent since instroduction to the institutional survey in 1993. 2020, in the early months of the COVID pandemic stireed a lot of sympathy for health care workers, which was obviously reflected in that survey. Now, more than two years into the pandemic, with things feeling more normal to many people, we seem to have returned to the longer term view of The Medical System as a reflection of care provided rather than empathy for the care providers. .
The greatest difference in response in 2022 is seen with higher confidence by Non-whites then Whites, and rising confidence with Party ID, from Republican to Independent to Democrat (much more definitive than the pattern for Ideoogy). That is interesting and seemingly paradoxical mix, since media portrayls during COVID have hammered away at the disproporationate impact of COVID on people of color.
Including Some, all cohorts maintain Overall Confidence in The Medical System by strong majorities.
Rank 5 2022: Organized Religion
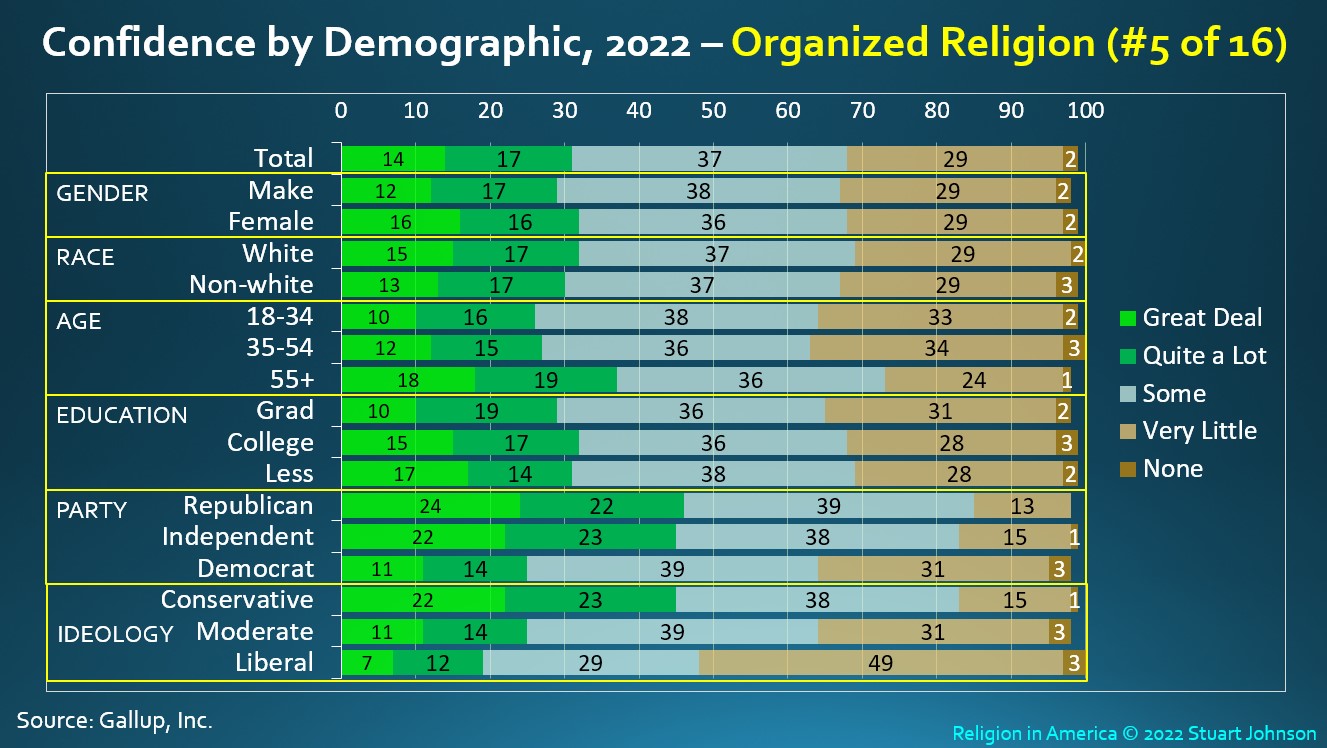
Organized Religion, which started at the top of Gallup's Institutional surveys in the 1970s, with a high Confidence Score of 68 in 1975, came in with a new low of 31% for 2022, Including Some, Overall Confidence rises to a strong 2/3 majority (68%).
- Age - while the two youngest age cohorts had virutally identical responses, thoes 55 and older were about 10 points higher in both Co\onfidence and Overall Confidence—not as much as might be expected
- Party ID - Republicans and Independents were very close and higher than Democrats by nearly 20 points.
- Ideology was marked by a decline from Conservative to Moderate to Liberal. The Liberal Confidence Score of 19 (Great Deal + A Lot) was less than the Conservative Great Deal at 22. Including Some widens the gap by nearly 40 points. For both Moderate and Liberals, Very Little reprsented the largest single response, with th e 49% for Liberals just short of a majority.
See the Digging Deeper section on Religous Service Attendance, which provides more detail form other surveys showing this political and ideological spli.
Rank 6 2022: Public Schools
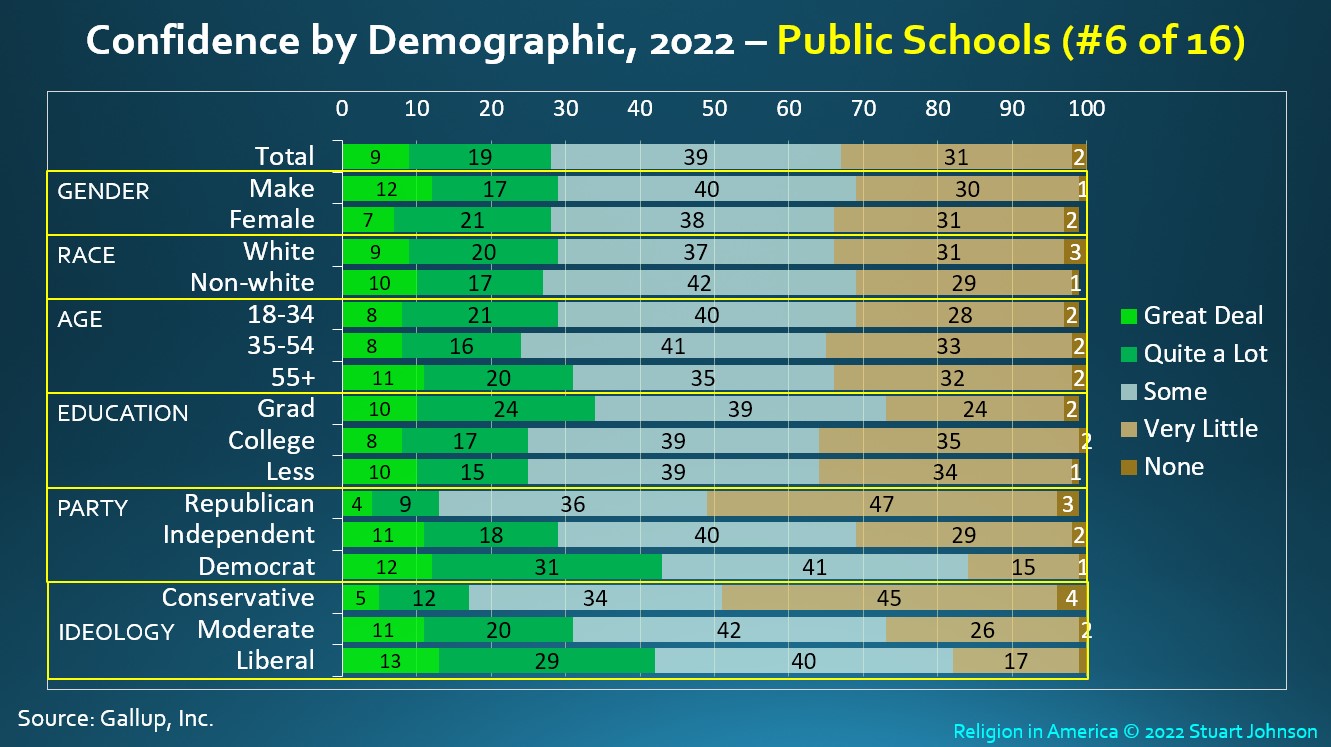
Public Schools rose four places to #6 in 2022, despite a Confidence Score that dropped six points, laregly because falling confidence in the Supreme Court and The Presidency dropped their rankings.
While thoe aged 35-54 showed weaker confidence in Public Schools than the overall survey response, and those with graduate education showed more confidence,
neither was as signfiicant as the political/ideological split: Both Party ID and Ideology stairstep from weak to moderate confidence (Republicans at 13% versus Democrats at 43%, Conservatives at 17% versus Liberals at 42%.
Just as Very Little confidence was the single largest response of Moderates and Liberals for Organized Religion, so it is for both Repluicans and Conservatives over Public Schools. In fact, on confidence in Publi Schools, we see a much cloeser relationship between Party ID and Ideology than iwas the case with nstitutions of higher rank, but it will be more typical now as we go down in rank.
Rank 7 2021: Organized Labor
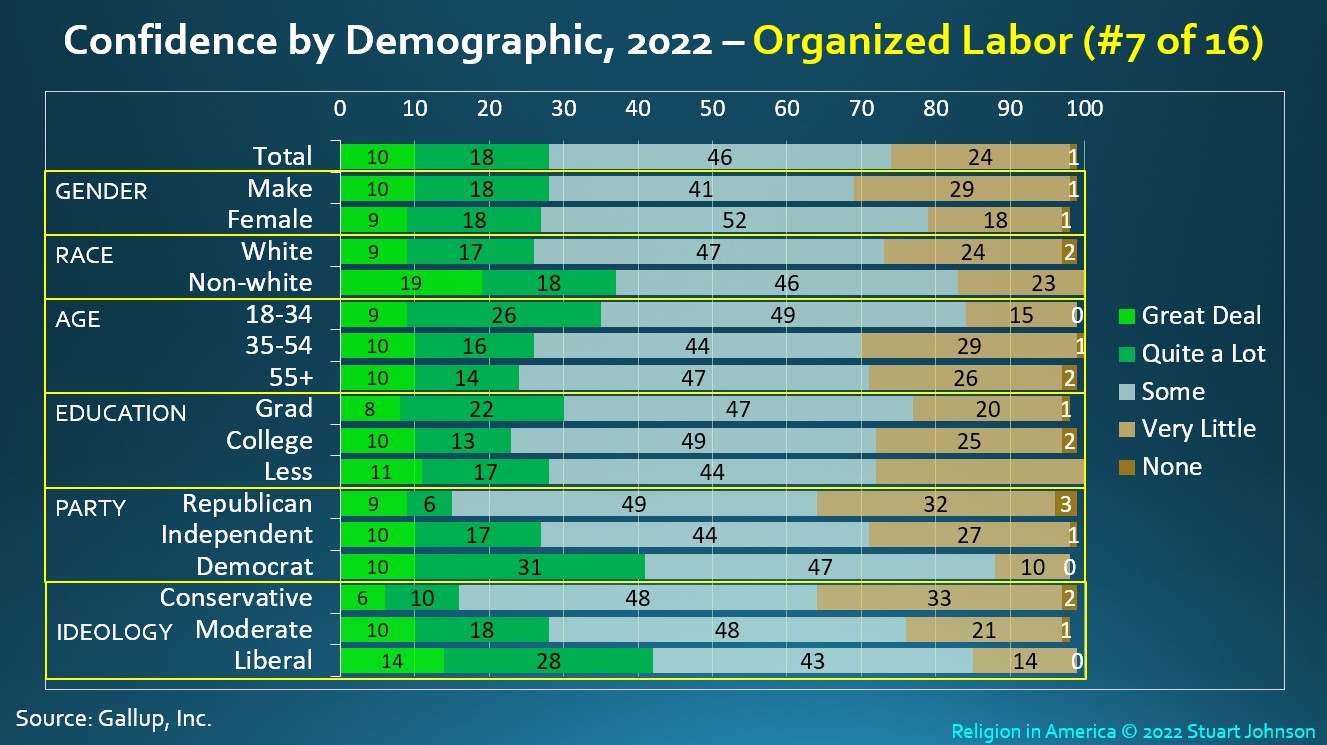
Organizes Labor, which in previous years was more likely to be in the lower half of rankings, moved into #7 in 2022, with the same Confidence Score of 28 from 2021. As with Public Schools, the ranking for Oranized Labor was due in large part to declines in the Supreme Court and The Presidency. Including Some, Organized Labor continues to find Overall Confidence from more than 7 in 10 Americans.
Organized Labor finds higher confidence among non-whites and in the youngest age cohort. But, as we saw with Public Schools, Party ID and Ideology show the greatest differences, with growing confidence from Republican (15%) to Modersate (27%0 to Democrat (41%) followed very close by Conservative (16%) to Moderate (25%) to Liberal (42%).
The highest Very Little for Organized Labor is found among Republicans and Conservatives, though far short of the near-majority seen with their view of Publi Schools, or Liberals toward Organized Religion (where the tie to Party ID is not as strong).
Rank 8 2021: Banks
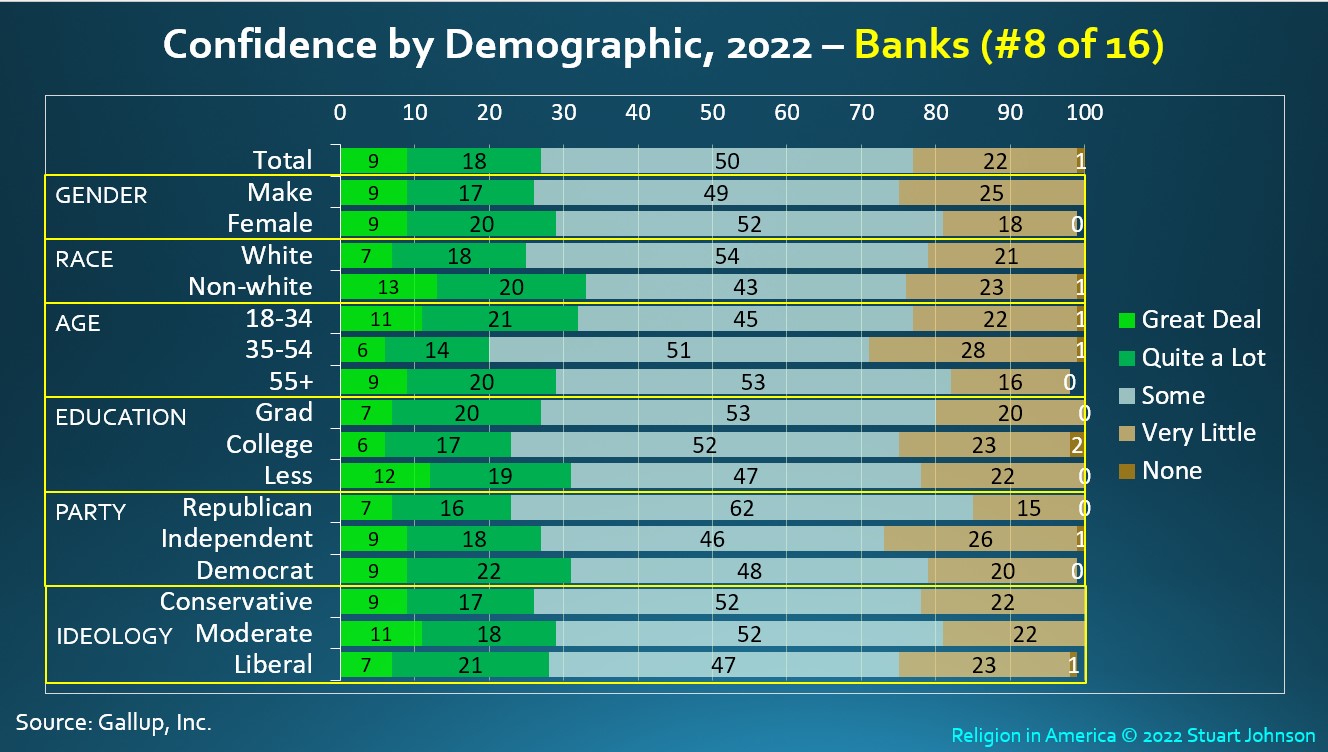
Banks round out the top-half of the 16 institutions in the 2022 survey and might be called "the great Lukewarm," with slightly higher Confdience (Great Deal and Quite a Lot) than Very Little, but close to or actual majorities of Some, starting with the overall response where Some is 50%, and being true for every cohort.
There is very little significant differene between the overall response and any one demogrpahic factor given a margin of error of roughly 5%. The weakest confidence is seen among those ages 35-54 at 20% (compared to 27% overall), accompanied by Some at 51% and the highest Very Little at 28%). But, the overall picture is a lot of blue (Some).
This Lukewarm picture is far different from the 60% Confidence Score enjoyed by Banks in 1979, the first year the institution appeared in the Gallup survey. Ironically, that was just before the great wave of inflation that made Jimmy Carter a one-term president, followed by another downturn in 1991 (which also contributed to George H. W. Bush being a one-term president, despite enormous popularity following the Gulf War). Neither downturn came near the plounge in confidence in 2009 following the Great Recession, from which recovery has been panfully slow (see the timeline in Part 3).
Before we go on, a call to reflect. As we continue into the bottom half of the list of institutions, we will see (very sadly, I must say) a growing rise of Very Little confidence among a widening range of demographic cohorts. While the Trump preseidency has been tied to "The Big Lie" of a stolen election and cries of "The Threat to Democracy" (some more political expediency than honest contemplation of the volatile history of the American experiment), the eroading confidence in our social institutions has been happening over a long time.
We can look at these numbers as if we are mere spectators. But, these institutions are as much "us" as "them," so what has happened to US since Gallup started asking about our confidence in thoes institutions back in 1973?
Rank 9 2022: Large Tech
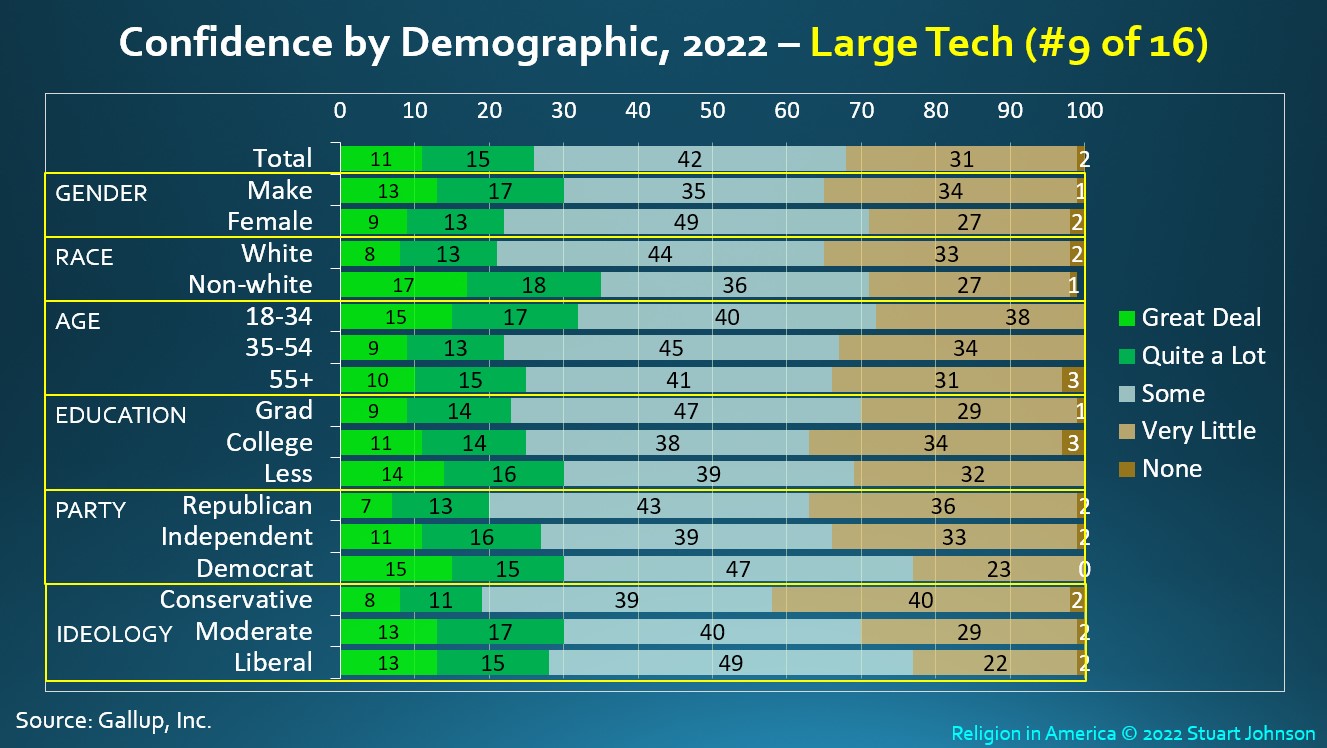
Large Tech was introduced in to the Gallup survey of institutional conifidence in 2020, with the survey conducted prior to the Republican and Democratic nominating conventions later in the summer that would pit incumbent Donald Trump again Joe Biden. Large Tech includes the major players in social media and the internet, including companies such as Facebook, Twitter, and Google who were facting mounting criticism for their role as players in shaping public opinion in ways that many users are not aware. (See a list of sux articles that I have written on the influence of Large Tech)
Large Tech went down in Score by 3 points, 5o 26 in 2022, but up two ranks to #9 because Science did not return and The Presidency went down to #11.Differences in responses are realtively close to the Overall rating, with the largest differnce in the higher confidence on non-Whites over Whites. Republians and Conservatives had less confidence than Independents, Democrats, Moderates or Liberals. Consertives have been complaining about being discriminated against in search results, news feeds and other areas where algoritms can greatly influence results (such things as the amount of coverage, sources, and whether what does appear can be seen as positive or negative). The strongest show of Very Little confidence comes from Conservatices (40% versus 31% for total responses, actually no worse than higher ranked institutions Organized Religion and Pubic Schools, and better than the lowest ranking institutions.)
NOTE: From this point on, Confidence Scores for 2022 are at or below 25 and there is a tendency for Overall Confidence (including "Some") to be approaching or below 50 (Majority).
Rank 10 2022: Supreme Court
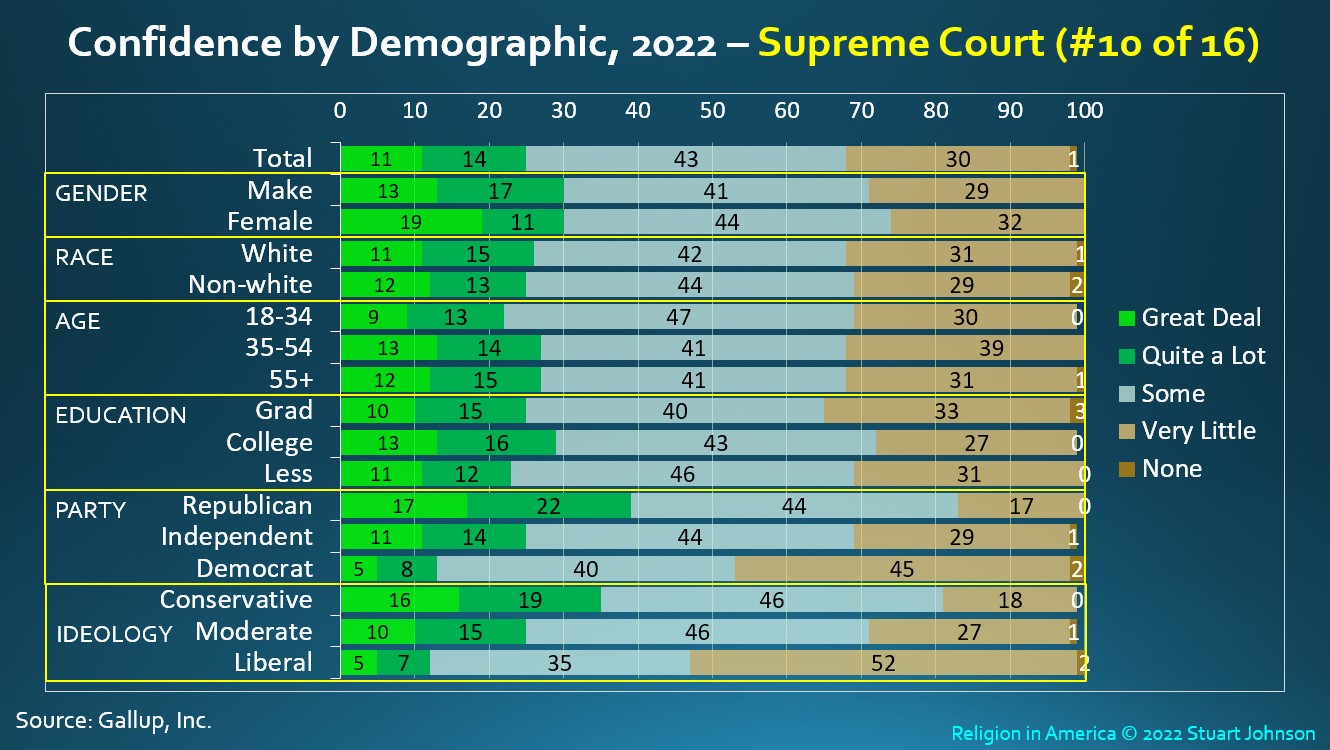
The Supreme Court dropped two ranks from 2021, to #10, and lost 11 points, dropping to an all-tome low Confidence Score of 25. The Gallup survey was conducted as news of the pending decision affect Roe v Wade dominated the news, driven by a leak of a first draft by Associate Justice Samuel Alita.
For most categories there is little significant difference between cohorts. Not suprisingly, the greatest differences are seen in Party ID and Ideology, where Republicans showed 39% confidence againt Democrats 13%, with Idependents in the middle at 25%. The pattern by Idoology was similar, but Conservatives were slightly down, with 35% Confidence. Nearly half of Republicans and Independts, along with Conservative and Liberals took the more neutral Some response, while more than half (52% of Liberals expressed Very Little confidence and Demovrats 45%.
It is important to note that while the drop to a new low may be the result of a specific ruling (and the timing of the suvey in relattion to that ruling), on other decisons the Party ID and Ideology could flip while confidence over time continues to go down. This will also be true of The Presidency, Congress and the Criminal Justice System. The overall level of confidenece for all of them, despite ups and downs, has been trending down
through numerous administrations and changes in the political winds. The Supreme Court is down 31 points from a high of 56 in 1988 and down 18 from the median Condifence Score of 43.
Rank 11 2022: The Presidency
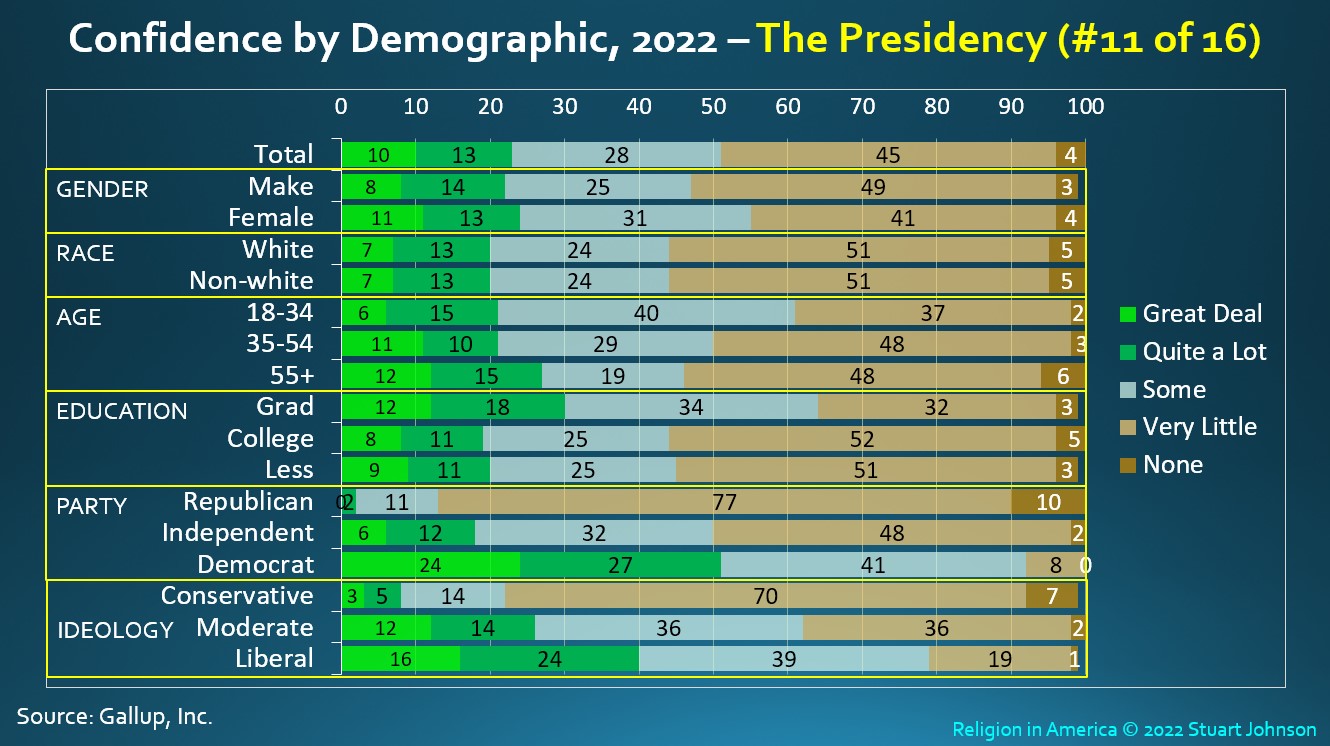
The Presidency suffered the biggest loss in confidence of all sixteeen insttiutitions since 2021, dropping 15 poiunts in Confidence Scote and falling five ranks from #6 to #11. Include Some, the Overall Confidence barely maintains a majority, at 51% (down from nearly two-thirds last year). See the timeline in Part 3 for the dramatic picture of the peaks and valleys from George H. W. Bush through the first two years under Joe Biden.
Females had higher confidence than Males, especially when including Some, which produced an Overall Confidence of 55. Respondents 55 years and older showed a slightly higher Confidence Score, but 35-54 were higher when including Some. Those with Graduate Education showed both a higher Confidence Score and Some, pushing their Overall Confidence over 60%.
Not surprisingly, the greatest differences follow Patty ID and Ideology. On Party ID, just over a majority of Democrats (51%) gave The Presidency high marks, raising it to 92% when including Some. Republican confidence was virtually nil and less than 20% wen including Some, while Independents were slightly more generous, with Overall Confidence (including Some) at 50%, but a Confidence Score that was not even close to Democrats on Great Deal alone. For Ideology, Conservatives and Moderates both showed slightly higher confidence than Republicans and Independents, but Liberals, while still far ahead of the others, were noticeably less enthusiastic than Democrats by Part ID.
Rank 12 2022: Newspapers
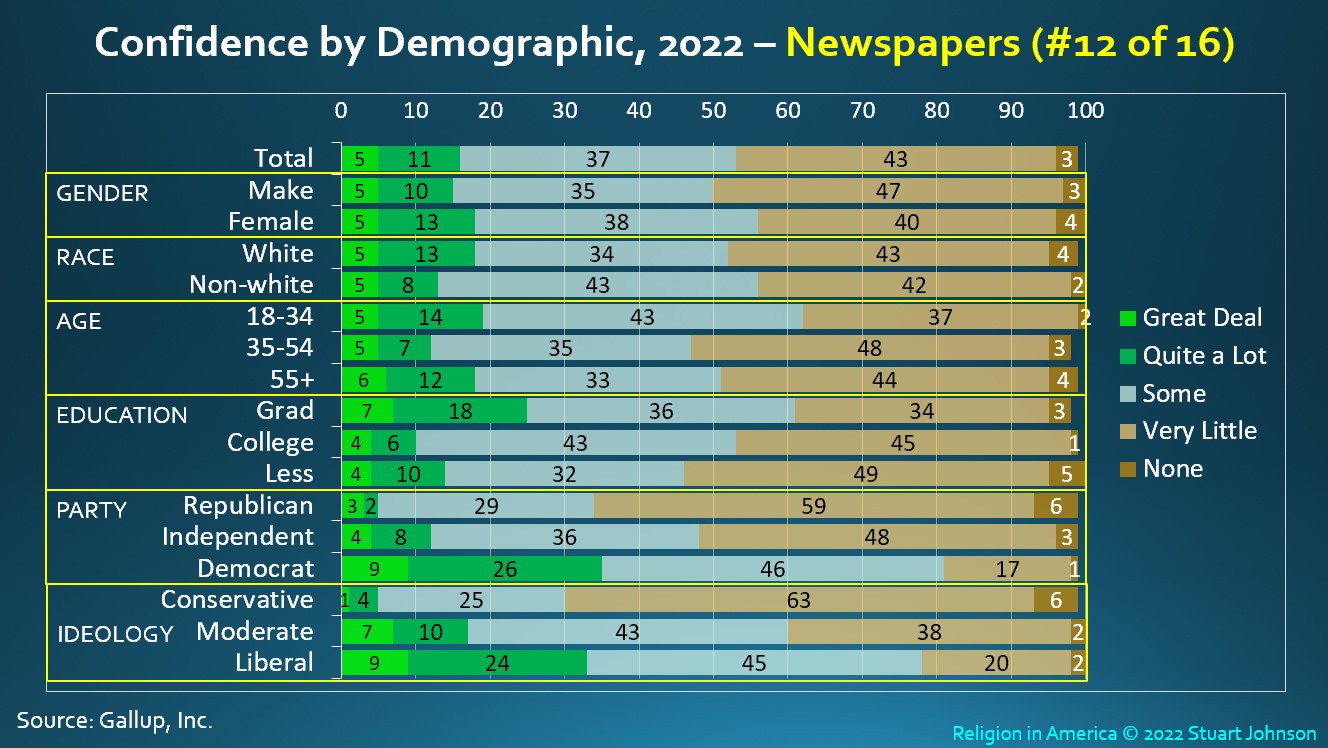
Newspapers have fallen in confidence from just over a majority in 1979 to a new lot of 16% in 2022, though Overall Confidence retains a bare majority of 53% when including Some.
Of course, since 1973 when the Gallup institutional survey began, newspapers have struggled to maintain a presence as network television grew in prominence through the 70s and 80s, followed by the rise of cable television and the emergence of 24/7 news channels in the 90s, followed by the intternet and social media, all providing enormous competition for newspapers. Cities that once had multiple daily papers(often with morning and evening editions) have dropped to one or two, or none, and many community papers have died off. Even among regional papers, such as The Daily Herald here n the Chicago suburbs, the newsroom is only a shell of what it once was, relying on the Associated Press or national papers like the Washington Post for most of the national and world news that used to come from its own correspondents.
With readership far off
historical levels (even with online availability), how much is confidence based on actual readership versus perceptions of newspaper? It's not unlike saying you hate broccoli without ever trying it.
As with other institutions, we see considerable differences along party and ideological lines. Democrats and Liberals express a Confidence Score more than double the total (35% and 33% versus 16%), while Republicans and Conservatives are less than half the Total, and Independents and Moderates are fairly close to the Total. Including Some, Independents and Moderates reach or exceed majority confidence. Democrats and Liberals shows Overall Confidence at upwards of 80%. Does this confirm the Republican/Conservative view of liberal media bias. After all, the mainstream media will naturally consider themselves to be neutral and unbiased, seeing alternate sources as right-wing extremism. Where is the line between "fairness" and "bias," and how much impact does it have on confidence?
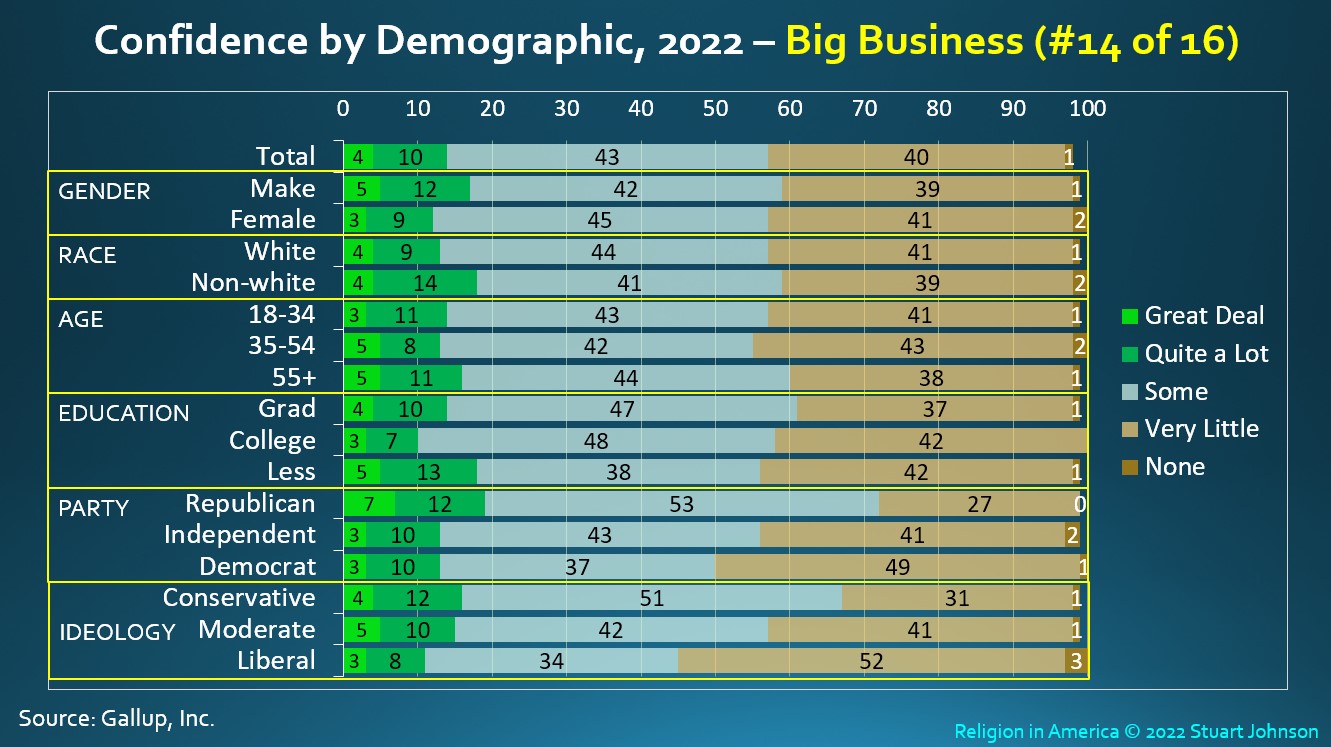
Rank 13 2022: Big Business

Big Business tied with the Criminal Justice System with a Confidence Score of 14 (both with 4 Great Deal, 10 Quite a lot) but is slightly ahead in Overall Confidence (Some of 43 versus 40 for Criminal Justice System). In addition, while both hit a record low, Big Business lost 4 points from 2021 against 10 for the Criminal Justice System.
With Some at 43% of all responses, Bib Business has a majority (57%) Overall Confidence. While it appears that some differences in Confidence Score are significant, most are within the margin of error. Most cohorts are at or above majority Overall Confidence. Most telling is the one-half of Liberals (52%) and Democrats (49%) who indicated Very Little confidence in Big Business, against roughly three in ten of Republicans (27%) and Conservatives (31%) . This is consistent with the long-standing perception that Republics/Conservatives tend to favor Big Business, while Democrats/Liberals favor Organized Labor.
The opposing allegiances of Organized Labor and Big Business along political/ideological lines reflects the age of industry. The inclusion of Large Tech as an institution reflects the shifting scene in America today—the age of information—with confidence for Large Tech along political/ideological lines coming closer to that of Organized Labor than Big Business.
Rank 14 2021: The Criminal Justice System
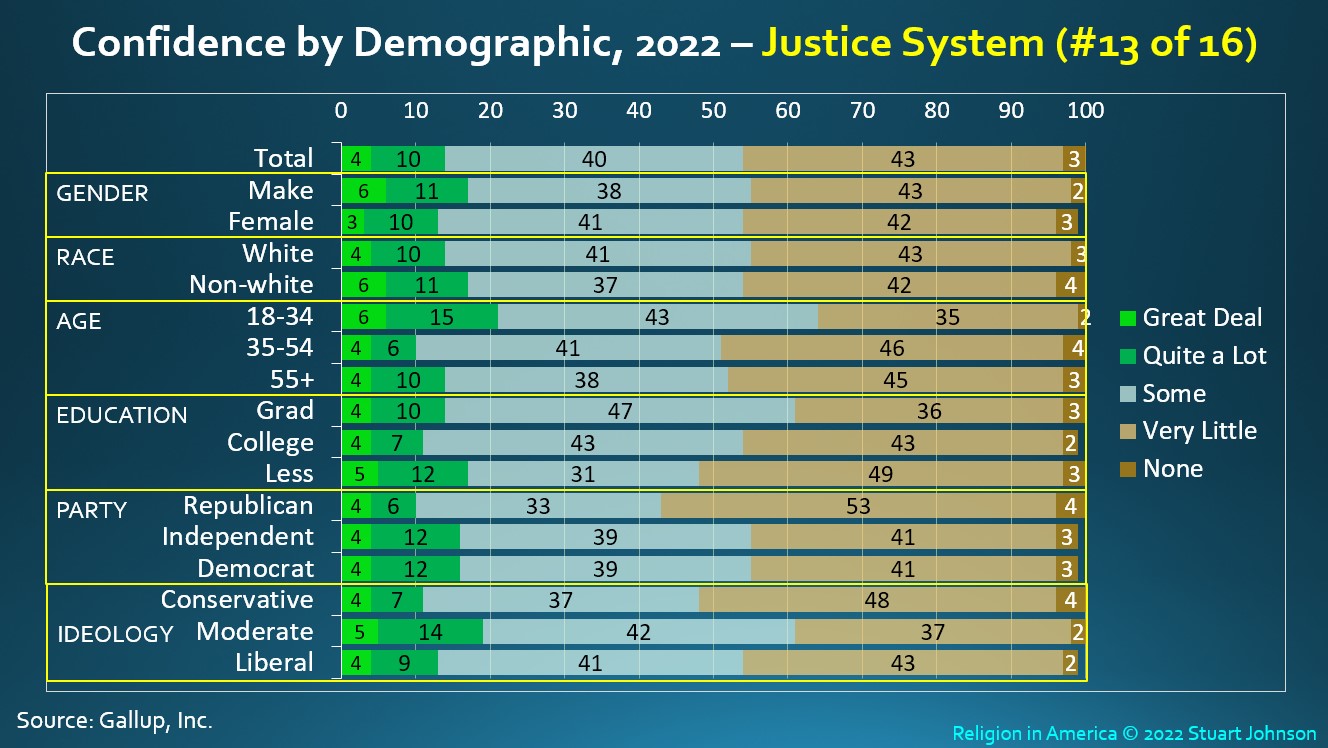
The Criminal Justice System dropped ten points from 2021, arriving at the same Confidence Score as Big Business, with which it swapped order in the rankings since Big Business had a slightly higher Overall Confidence.
Ten points in a big loss, especially when Confidence was already below 25%, so it will be important to watch the rate of change over the next two or three years. The number of record lows, including this one, could indicate a kind of national depression fueled by COVID fatigue and the cultural/political divisiveness that has poisoned the well of public trust. As noted earlier with Banks, there is a tendency toward "Lukewarm" responses in 2022. The Crimnal Justice System, along with the institutions preceding it in rank, hit record low Confidence Scored, but maintianed Overall Confidence at or slightly above a majority. That means, of course, that a strong minority express Very Little confidence. It is not until we reach the last two institutions—TV News and Congress—that Overall Confidence drops below 50%/
While there are differences in demographic factors, they are relatively mild compared to the other institutions below the 25% Confidence Score. Those leaning most toward higher confidence in the Criminal Justice System include 18-34 years of Age and Moderates. Because of the moderating influence of Some, a more significant measure of low confidence in Very Little, led by Republicans and Conservatives. While that difference is notable, it is worth pointing out how close Conservatives and Liberals were (11 versus 13 in Confidence Score, 48 versus 53 in Overall Confidence. None of these show the stark demographic divide seen in other institutions, but a troubling loss of confidence overall. The highest level achieved by the Criminal Justice System was in 2004 when the Confidence Score reached 34 and nearly three-quarters expressed Overall Confidence.
Rank 15 2022: TV News
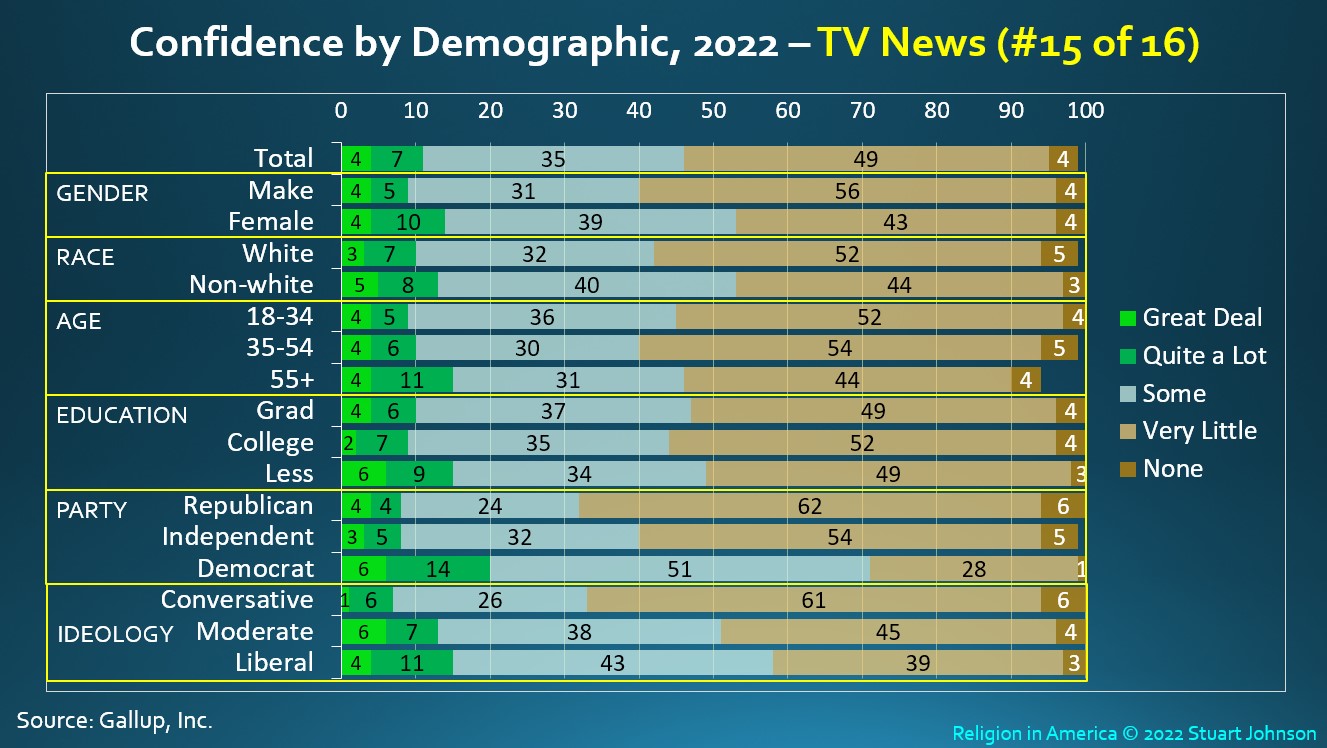
TV News, along with nine other institutions, hit a record low Confidence Score in 2022. TV News, was introduced to the Gallup survey in 1993 when it had a Confidence Score of 46—a time when CNN was beginning to show the influence of 24/7 cable news after decades of reliance on the three major broadcast networks, (TV News is one of six institutions which has never had a majority Confidence Score in the Gallup survey, including Congress, Organized Labor, the Criminal Justice System, Big Business, and Large Tech (the last introduced in 2020).
You might think that the greater availability of news on cable television (and the lengthening of nightly network newscasts from 15- to 30-muntes) might increase confidence, but if you look at the timeline in Part 3, TV News shows a very steady erosion in confidence since 1993, more like Organized Religion than Congress (which has gone down in similar extent, but with more upward bumps along the way).
Not surprisingly, the greatest demographic difference, as has been the case with other institutions, is found in Party ID and Ideology.
For 2022, Democrats showed a Confidence Score of 20 against 8 for both Republicans and Independents, with Overall Confidence of 71 (compared to 32 for Republicans and 40 for Independents). By Ideology, Conservatives still show about half the confidence of Liberals, but Moderates move closer to the Liberal position. As with Newspapers, the decidedly more negative view of Republicans and Conservatives affirms the widely held view of a liberal media bias. It is interesting, however, that Independents are more aligned with Republicans on Party ID and Moderates with Liberals on Ideology.
It could be argued that it is the Republican/Conservative bias against the mainstream media that is dragging down confidence over time, yet the decline has been steady and even the Confidence Score for Democrats and Liberals is
no more than 20%. Looking at Overall Confidence (including Some), only Females, Non-whites, Democrats and Liberals reach or exceed a majority (the strongest being Democrats at 71%). At the same time, six in ten Republicans and Conservatives show Very Little confidence in TV News (62% and 61%), as well as majorities of Males, Whites, those under 55, and Independents. By education, those with College education have a slight majority of Very Little (52%) but both Grad and Less then college are just under, at 49% each (within the margin of error)- showing that education level is the weakest indicator of confidence in TV News.
Rank 16 2022: Congress
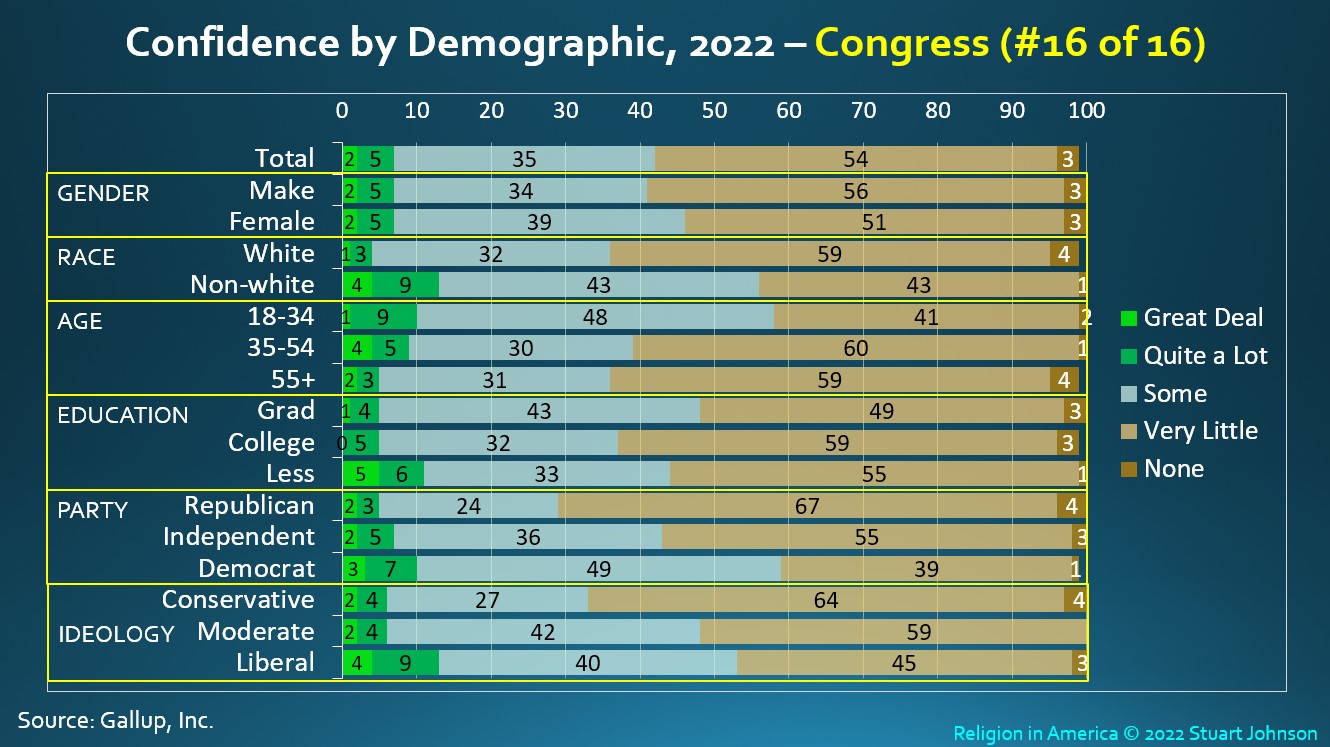
Congress has been at the bottom of confidence for some time. It's record low of 7 in 2022 is 35 points off its high of 42 when the Gallup survey started in 1973 and 14 points lower than its median Confidence Score of 24. Overall Confidence in 2022 was 42—the Confidence Score in 1973—with 54% of respondents expressing Very Little confidence.
While the Confidence Score for Democrats is twice that of Republicans (10 to 5), the number is so low as to be of minimal significance. More significant is Some approaching majority levels for Democrats and those under age 35. The strongest Very Little in 2022 came from two-thirds of Republicans (67%) and nearly that proportion of Conservatives (64%).. On the other hand, the only cohorts with less a majority of Very Little in 2022 were Non-whites, those under 35, those with Graduate education (just under a majority at 49), Democrats and Liberals—though Party ID and Ideology are the most likely to flip, depending on the composition of a particular Congress.
Religion in America
Digging Deeper: Confidence Part 2 - Demographics
This page was added September 9, 2022
Part 1 —Overview: 2022 Trends, impact of "Some" responses, breakdown of responses for historic Highs and Lows
Part 3—Historic timeline charts tracking survey results for each institution
< back to Religion in America summary
Summary
The following charts provide an anlysis of the demographic breakdown provided by Gallup for f the 16 institution covered it ins 2022 survey of Confidence in American Institutions.
When looking at charts, remember that the Gallup confidence survey is released in July, so it actually reflects responses in the second quarter of the year. This is especially important when considering elections and significant events, such as September 11 that would have occurred later that calendar year.
Survey Profile
The chart above shows weighted distributions, where small adjustments are made to make the distribution of resopndents more closely fit the general adult population. Even as survey research become more difficult in the age of cell phones and the internet, Gallup's research methods have remained solid and weighting is minimal compated to other survesy I have seen where the sample if wildly out of line with the population. The sample size and selection processused by Gallup produce a margin of error of about 5%.
Notice that none of the demographic categories is split into more than three cohorts. The sample size would have to increase significantly to allow further divisions while maintaining acceptable accuracy.
You will see some differenes attributable to other factos, but generally speaking Party ID and Ideology is where you will see the gretest differences in confidence.
While there is considrable redunancy between Party ID and Ideology, you will see in the details that follow how they sometimes track very closely and other times show divergence between ideology and part.y. .
The Details
The following charts are sorted by 2022 Confidence Score (Great Deal + Quite a Lot responses). Reference to Overall Confidence includes "Some" responses. Some institutions have shown a decline in Confidence Score, while the Overall Confidence has remained more stable. The "Trend" indicated in the details of each is my own assessment to characterize each institution.
Browse the page, or click on a thumbnail image here to select an institution. Clicking on a timeline chart will open an enlarged version in another tab or window. Close it to return here.
Rank 1 2022: Small Business
More than two-thirds of respondents (68%) expressed confidence in Small Business (Great Deal or Quite a Lot). Still very strong, it is down from a high of 75% in 2020 in the early days of the COVID pandemic, when many businesses were impacted by strict lockdowns, arousing public sentiment. Small Busienss was added to the Gallup survey of instituionl confidence in 2007, so it is relatively new, with others going back to 1973.
While all cohorts showed solid majority confidence in 2022, non-whites and those with less than a college education expressed somewhat lower, though still majority, confidence.
Rank 2 2021: The Military
As with Small Business, a solid majority of nearly two-thirds (64%) expressed confidence in The Military.
While variation are not highly signfiicant (remember, the margin of error is about 5%), by a relatively small margin support for The Military was strogest among whites, those 55 years of age and older, and Republicans. By party ID while Independents still showed majority confidence, it was weaker than either Republicans or Democracts (Republicans did have the strongest Great Deal response of all demographic cohorts). By ideology, Liberals also had majority but weaker confidence than conservatives or moderates, who came out with nearly identical scores across the responses.
Rank 3 2022: The Police
Confidence in The Police dropped below a bare majority (51%)in 2022, to 45%, down from its high of 64% in 2004. The Police as an institution was introduced to the Gallup survey in 1993.
Reflecting the social unrest surrounding relationships between the police and communities, seen in the demonstrations and riots across the natioan in summer of 2020 following the death of George Floyd at the hands of Minneapolis police, demograpic responses overall remain quite varied:
- Gender: little difference between men and women
- Race: Whites much higher confidence than non-whites. most notaby with Great Deal three times that of non-whites (25% vs. 8%), while Quite a Lot and Some were actually fairly close.
- Age: Confidence in The Police increases with age, though 71% of those 18-34 years old had at least Some confidence.
- Education: not a major factor, with all categories fairly close to the Total distribution
- Party ID showed the greatest difference, with Republicans showing the highest Score of all cohorts (67% against only 28% for Democrats), though both Independents and Democrats had majority confidence when including Some
- Ideology followed a similar pattern to party ID, with 60% of Conserevaties and only 23% of :Liberals expressing high confidence. Once again, however, even Liberals showed 2/3 confidence (65%) when including Some, while 1/3 (33%) expressed Very Little confidence in The Police.
Rank 4 2022: The Medical System
The Medical System dropped to 38% Confidence in 2022, follwoing a high of 51% in 2020. If you look at the Timeline chart for The Medical System in Part 3 you will see that responses have been fairly consistent since instroduction to the institutional survey in 1993. 2020, in the early months of the COVID pandemic stireed a lot of sympathy for health care workers, which was obviously reflected in that survey. Now, more than two years into the pandemic, with things feeling more normal to many people, we seem to have returned to the longer term view of The Medical System as a reflection of care provided rather than empathy for the care providers. .
The greatest difference in response in 2022 is seen with higher confidence by Non-whites then Whites, and rising confidence with Party ID, from Republican to Independent to Democrat (much more definitive than the pattern for Ideoogy). That is interesting and seemingly paradoxical mix, since media portrayls during COVID have hammered away at the disproporationate impact of COVID on people of color.
Including Some, all cohorts maintain Overall Confidence in The Medical System by strong majorities.
Rank 5 2022: Organized Religion
Organized Religion, which started at the top of Gallup's Institutional surveys in the 1970s, with a high Confidence Score of 68 in 1975, came in with a new low of 31% for 2022, Including Some, Overall Confidence rises to a strong 2/3 majority (68%).
- Age - while the two youngest age cohorts had virutally identical responses, thoes 55 and older were about 10 points higher in both Co\onfidence and Overall Confidence—not as much as might be expected
- Party ID - Republicans and Independents were very close and higher than Democrats by nearly 20 points.
- Ideology was marked by a decline from Conservative to Moderate to Liberal. The Liberal Confidence Score of 19 (Great Deal + A Lot) was less than the Conservative Great Deal at 22. Including Some widens the gap by nearly 40 points. For both Moderate and Liberals, Very Little reprsented the largest single response, with th e 49% for Liberals just short of a majority.
See the Digging Deeper section on Religous Service Attendance, which provides more detail form other surveys showing this political and ideological spli.
Rank 6 2022: Public Schools
Public Schools rose four places to #6 in 2022, despite a Confidence Score that dropped six points, laregly because falling confidence in the Supreme Court and The Presidency dropped their rankings.
While thoe aged 35-54 showed weaker confidence in Public Schools than the overall survey response, and those with graduate education showed more confidence,
neither was as signfiicant as the political/ideological split: Both Party ID and Ideology stairstep from weak to moderate confidence (Republicans at 13% versus Democrats at 43%, Conservatives at 17% versus Liberals at 42%.
Just as Very Little confidence was the single largest response of Moderates and Liberals for Organized Religion, so it is for both Repluicans and Conservatives over Public Schools. In fact, on confidence in Publi Schools, we see a much cloeser relationship between Party ID and Ideology than iwas the case with nstitutions of higher rank, but it will be more typical now as we go down in rank.
Rank 7 2021: Organized Labor
Organizes Labor, which in previous years was more likely to be in the lower half of rankings, moved into #7 in 2022, with the same Confidence Score of 28 from 2021. As with Public Schools, the ranking for Oranized Labor was due in large part to declines in the Supreme Court and The Presidency. Including Some, Organized Labor continues to find Overall Confidence from more than 7 in 10 Americans.
Organized Labor finds higher confidence among non-whites and in the youngest age cohort. But, as we saw with Public Schools, Party ID and Ideology show the greatest differences, with growing confidence from Republican (15%) to Modersate (27%0 to Democrat (41%) followed very close by Conservative (16%) to Moderate (25%) to Liberal (42%).
The highest Very Little for Organized Labor is found among Republicans and Conservatives, though far short of the near-majority seen with their view of Publi Schools, or Liberals toward Organized Religion (where the tie to Party ID is not as strong).
Rank 8 2021: Banks
Banks round out the top-half of the 16 institutions in the 2022 survey and might be called "the great Lukewarm," with slightly higher Confdience (Great Deal and Quite a Lot) than Very Little, but close to or actual majorities of Some, starting with the overall response where Some is 50%, and being true for every cohort.
There is very little significant differene between the overall response and any one demogrpahic factor given a margin of error of roughly 5%. The weakest confidence is seen among those ages 35-54 at 20% (compared to 27% overall), accompanied by Some at 51% and the highest Very Little at 28%). But, the overall picture is a lot of blue (Some).
This Lukewarm picture is far different from the 60% Confidence Score enjoyed by Banks in 1979, the first year the institution appeared in the Gallup survey. Ironically, that was just before the great wave of inflation that made Jimmy Carter a one-term president, followed by another downturn in 1991 (which also contributed to George H. W. Bush being a one-term president, despite enormous popularity following the Gulf War). Neither downturn came near the plounge in confidence in 2009 following the Great Recession, from which recovery has been panfully slow (see the timeline in Part 3).
Before we go on, a call to reflect. As we continue into the bottom half of the list of institutions, we will see (very sadly, I must say) a growing rise of Very Little confidence among a widening range of demographic cohorts. While the Trump preseidency has been tied to "The Big Lie" of a stolen election and cries of "The Threat to Democracy" (some more political expediency than honest contemplation of the volatile history of the American experiment), the eroading confidence in our social institutions has been happening over a long time.
We can look at these numbers as if we are mere spectators. But, these institutions are as much "us" as "them," so what has happened to US since Gallup started asking about our confidence in thoes institutions back in 1973?
Rank 9 2022: Large Tech
Large Tech was introduced in to the Gallup survey of institutional conifidence in 2020, with the survey conducted prior to the Republican and Democratic nominating conventions later in the summer that would pit incumbent Donald Trump again Joe Biden. Large Tech includes the major players in social media and the internet, including companies such as Facebook, Twitter, and Google who were facting mounting criticism for their role as players in shaping public opinion in ways that many users are not aware. (See a list of sux articles that I have written on the influence of Large Tech)
Large Tech went down in Score by 3 points, 5o 26 in 2022, but up two ranks to #9 because Science did not return and The Presidency went down to #11.Differences in responses are realtively close to the Overall rating, with the largest differnce in the higher confidence on non-Whites over Whites. Republians and Conservatives had less confidence than Independents, Democrats, Moderates or Liberals. Consertives have been complaining about being discriminated against in search results, news feeds and other areas where algoritms can greatly influence results (such things as the amount of coverage, sources, and whether what does appear can be seen as positive or negative). The strongest show of Very Little confidence comes from Conservatices (40% versus 31% for total responses, actually no worse than higher ranked institutions Organized Religion and Pubic Schools, and better than the lowest ranking institutions.)
NOTE: From this point on, Confidence Scores for 2022 are at or below 25 and there is a tendency for Overall Confidence (including "Some") to be approaching or below 50 (Majority).
Rank 10 2022: Supreme Court
The Supreme Court dropped two ranks from 2021, to #10, and lost 11 points, dropping to an all-tome low Confidence Score of 25. The Gallup survey was conducted as news of the pending decision affect Roe v Wade dominated the news, driven by a leak of a first draft by Associate Justice Samuel Alita.
For most categories there is little significant difference between cohorts. Not suprisingly, the greatest differences are seen in Party ID and Ideology, where Republicans showed 39% confidence againt Democrats 13%, with Idependents in the middle at 25%. The pattern by Idoology was similar, but Conservatives were slightly down, with 35% Confidence. Nearly half of Republicans and Independts, along with Conservative and Liberals took the more neutral Some response, while more than half (52% of Liberals expressed Very Little confidence and Demovrats 45%.
It is important to note that while the drop to a new low may be the result of a specific ruling (and the timing of the suvey in relattion to that ruling), on other decisons the Party ID and Ideology could flip while confidence over time continues to go down. This will also be true of The Presidency, Congress and the Criminal Justice System. The overall level of confidenece for all of them, despite ups and downs, has been trending down
through numerous administrations and changes in the political winds. The Supreme Court is down 31 points from a high of 56 in 1988 and down 18 from the median Condifence Score of 43.
Rank 11 2022: The Presidency
The Presidency suffered the biggest loss in confidence of all sixteeen insttiutitions since 2021, dropping 15 poiunts in Confidence Scote and falling five ranks from #6 to #11. Include Some, the Overall Confidence barely maintains a majority, at 51% (down from nearly two-thirds last year). See the timeline in Part 3 for the dramatic picture of the peaks and valleys from George H. W. Bush through the first two years under Joe Biden.
Females had higher confidence than Males, especially when including Some, which produced an Overall Confidence of 55. Respondents 55 years and older showed a slightly higher Confidence Score, but 35-54 were higher when including Some. Those with Graduate Education showed both a higher Confidence Score and Some, pushing their Overall Confidence over 60%.
Not surprisingly, the greatest differences follow Patty ID and Ideology. On Party ID, just over a majority of Democrats (51%) gave The Presidency high marks, raising it to 92% when including Some. Republican confidence was virtually nil and less than 20% wen including Some, while Independents were slightly more generous, with Overall Confidence (including Some) at 50%, but a Confidence Score that was not even close to Democrats on Great Deal alone. For Ideology, Conservatives and Moderates both showed slightly higher confidence than Republicans and Independents, but Liberals, while still far ahead of the others, were noticeably less enthusiastic than Democrats by Part ID.
Rank 12 2022: Newspapers
Newspapers have fallen in confidence from just over a majority in 1979 to a new lot of 16% in 2022, though Overall Confidence retains a bare majority of 53% when including Some.
Of course, since 1973 when the Gallup institutional survey began, newspapers have struggled to maintain a presence as network television grew in prominence through the 70s and 80s, followed by the rise of cable television and the emergence of 24/7 news channels in the 90s, followed by the intternet and social media, all providing enormous competition for newspapers. Cities that once had multiple daily papers(often with morning and evening editions) have dropped to one or two, or none, and many community papers have died off. Even among regional papers, such as The Daily Herald here n the Chicago suburbs, the newsroom is only a shell of what it once was, relying on the Associated Press or national papers like the Washington Post for most of the national and world news that used to come from its own correspondents.
With readership far off
historical levels (even with online availability), how much is confidence based on actual readership versus perceptions of newspaper? It's not unlike saying you hate broccoli without ever trying it.
As with other institutions, we see considerable differences along party and ideological lines. Democrats and Liberals express a Confidence Score more than double the total (35% and 33% versus 16%), while Republicans and Conservatives are less than half the Total, and Independents and Moderates are fairly close to the Total. Including Some, Independents and Moderates reach or exceed majority confidence. Democrats and Liberals shows Overall Confidence at upwards of 80%. Does this confirm the Republican/Conservative view of liberal media bias. After all, the mainstream media will naturally consider themselves to be neutral and unbiased, seeing alternate sources as right-wing extremism. Where is the line between "fairness" and "bias," and how much impact does it have on confidence?
Rank 13 2022: Big Business
Big Business tied with the Criminal Justice System with a Confidence Score of 14 (both with 4 Great Deal, 10 Quite a lot) but is slightly ahead in Overall Confidence (Some of 43 versus 40 for Criminal Justice System). In addition, while both hit a record low, Big Business lost 4 points from 2021 against 10 for the Criminal Justice System.
With Some at 43% of all responses, Bib Business has a majority (57%) Overall Confidence. While it appears that some differences in Confidence Score are significant, most are within the margin of error. Most cohorts are at or above majority Overall Confidence. Most telling is the one-half of Liberals (52%) and Democrats (49%) who indicated Very Little confidence in Big Business, against roughly three in ten of Republicans (27%) and Conservatives (31%) . This is consistent with the long-standing perception that Republics/Conservatives tend to favor Big Business, while Democrats/Liberals favor Organized Labor.
The opposing allegiances of Organized Labor and Big Business along political/ideological lines reflects the age of industry. The inclusion of Large Tech as an institution reflects the shifting scene in America today—the age of information—with confidence for Large Tech along political/ideological lines coming closer to that of Organized Labor than Big Business.
Rank 14 2021: The Criminal Justice System
The Criminal Justice System dropped ten points from 2021, arriving at the same Confidence Score as Big Business, with which it swapped order in the rankings since Big Business had a slightly higher Overall Confidence.
Ten points in a big loss, especially when Confidence was already below 25%, so it will be important to watch the rate of change over the next two or three years. The number of record lows, including this one, could indicate a kind of national depression fueled by COVID fatigue and the cultural/political divisiveness that has poisoned the well of public trust. As noted earlier with Banks, there is a tendency toward "Lukewarm" responses in 2022. The Crimnal Justice System, along with the institutions preceding it in rank, hit record low Confidence Scored, but maintianed Overall Confidence at or slightly above a majority. That means, of course, that a strong minority express Very Little confidence. It is not until we reach the last two institutions—TV News and Congress—that Overall Confidence drops below 50%/
While there are differences in demographic factors, they are relatively mild compared to the other institutions below the 25% Confidence Score. Those leaning most toward higher confidence in the Criminal Justice System include 18-34 years of Age and Moderates. Because of the moderating influence of Some, a more significant measure of low confidence in Very Little, led by Republicans and Conservatives. While that difference is notable, it is worth pointing out how close Conservatives and Liberals were (11 versus 13 in Confidence Score, 48 versus 53 in Overall Confidence. None of these show the stark demographic divide seen in other institutions, but a troubling loss of confidence overall. The highest level achieved by the Criminal Justice System was in 2004 when the Confidence Score reached 34 and nearly three-quarters expressed Overall Confidence.
Rank 15 2022: TV News
TV News, along with nine other institutions, hit a record low Confidence Score in 2022. TV News, was introduced to the Gallup survey in 1993 when it had a Confidence Score of 46—a time when CNN was beginning to show the influence of 24/7 cable news after decades of reliance on the three major broadcast networks, (TV News is one of six institutions which has never had a majority Confidence Score in the Gallup survey, including Congress, Organized Labor, the Criminal Justice System, Big Business, and Large Tech (the last introduced in 2020).
You might think that the greater availability of news on cable television (and the lengthening of nightly network newscasts from 15- to 30-muntes) might increase confidence, but if you look at the timeline in Part 3, TV News shows a very steady erosion in confidence since 1993, more like Organized Religion than Congress (which has gone down in similar extent, but with more upward bumps along the way).
Not surprisingly, the greatest demographic difference, as has been the case with other institutions, is found in Party ID and Ideology.
For 2022, Democrats showed a Confidence Score of 20 against 8 for both Republicans and Independents, with Overall Confidence of 71 (compared to 32 for Republicans and 40 for Independents). By Ideology, Conservatives still show about half the confidence of Liberals, but Moderates move closer to the Liberal position. As with Newspapers, the decidedly more negative view of Republicans and Conservatives affirms the widely held view of a liberal media bias. It is interesting, however, that Independents are more aligned with Republicans on Party ID and Moderates with Liberals on Ideology.
It could be argued that it is the Republican/Conservative bias against the mainstream media that is dragging down confidence over time, yet the decline has been steady and even the Confidence Score for Democrats and Liberals is
no more than 20%. Looking at Overall Confidence (including Some), only Females, Non-whites, Democrats and Liberals reach or exceed a majority (the strongest being Democrats at 71%). At the same time, six in ten Republicans and Conservatives show Very Little confidence in TV News (62% and 61%), as well as majorities of Males, Whites, those under 55, and Independents. By education, those with College education have a slight majority of Very Little (52%) but both Grad and Less then college are just under, at 49% each (within the margin of error)- showing that education level is the weakest indicator of confidence in TV News.
Rank 16 2022: Congress
Congress has been at the bottom of confidence for some time. It's record low of 7 in 2022 is 35 points off its high of 42 when the Gallup survey started in 1973 and 14 points lower than its median Confidence Score of 24. Overall Confidence in 2022 was 42—the Confidence Score in 1973—with 54% of respondents expressing Very Little confidence.
While the Confidence Score for Democrats is twice that of Republicans (10 to 5), the number is so low as to be of minimal significance. More significant is Some approaching majority levels for Democrats and those under age 35. The strongest Very Little in 2022 came from two-thirds of Republicans (67%) and nearly that proportion of Conservatives (64%).. On the other hand, the only cohorts with less a majority of Very Little in 2022 were Non-whites, those under 35, those with Graduate education (just under a majority at 49), Democrats and Liberals—though Party ID and Ideology are the most likely to flip, depending on the composition of a particular Congress.