
Making Information Make Sense
Religion in America
Digging Deeper: Confidence Part 1 (Overview)
Part 2 (NEW) —Demographic breakdown for each institution.
Part 3—Historic timeline charts tracking survey results for each institution (except Large Tech, which has only been in the survey three years, so more time is needed to develop its history).
updated August 31, 2022
< back to Religion in America summary
Summary
The following charts provide additional detail for the Gallup survey of Confidence in U.S. Institutions. Gallup began this survey in 1973, asking people about their confidence in 15 major institutions. Over the years, the number has varied between 15 and 17 (those added since 1973 are indicated in brackets on the charts in the Summary page).
The Details
Browse the page or click on an item to go directly to that section. "Score" refers to sum of "Great Deal" and "Quite a Lot" of confidence.
- Trend: comparison of 2021 to 2020 and Median Scores
- 2021 Score versus High and Median Scores
- Including "Some" in Breakdown of Responses
- Breakdown of Responses by Historic High
- Breakdown of Responses by Historic Low
2022 Trends
Figure 1 - Confidence in U.S. Institutions - 2022 Top Tier
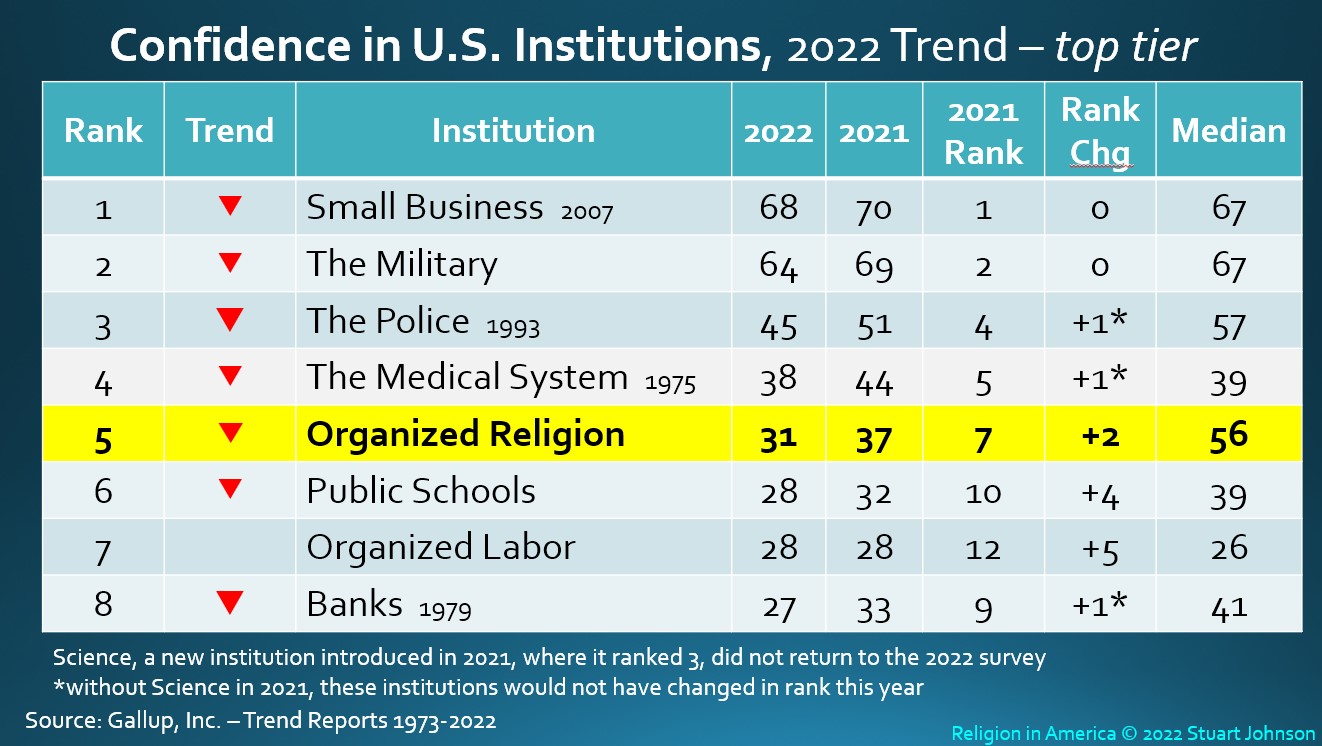
The confidence "Score" is the percentage of respondents indicating a "great deal" or "quite a lot" of confidence in an institution (compared to those expressing "some," "very little," or "none"). The arrow indicates the direction of change from 2020, with the size of the arrow signifying relative magnitude of the change.
Last year we saw confidence levels turn downward again after 10 of 16 took an unusual upward turn in 2020, which I attributed to a positive feeling toward those institutions as they responded during the early days of the COVID-19 pandemic. A year later COVID fatigue had set in and while some institutions remained elevated in rank, all 16 of those surveyed in 2021 declined. By 2022, COVID was still here, but while still official labeled a pandemic, it began to feel more like an endemic, with widespread but relatively mild symptoms for those who have been vaccinated and boosted. Whether related to ongoing fatigue and growing malaise or simply a resumption of the downward trend in confidence, all but one (Organized Labor) went down in 2022, 10 of the 16 to record low confidence levels.
The upward movement in rank was caused by Gallup's introduction of Science as an institution in 2021, at rank 3, which pushed all the remaining institutions down at least one rank. Science was not used again in 2022, so all of those changing rank by +1 were simply returning to where they would have been. This included 8 of the 16 institutions in the 2022 survey.
The Medical System, which was propelled from number 7 in 2019 to number 3 in 2020, with a 15 point increase in confidence, settled back in 2021, losing 7 points and dropping two ranks to number 5, then losing another 6 points in 2022, but moving up to number 4 (helped by the absence of Science).
Organized Religion recovered in ranking, moving up to number 5, but lost six points, falling to its all-time low confidence score of 31.
The upward movement in ranking for Organized Religion, Public Schools and Organized Labor has more to do with the downward movement institutions that moved into the bottom tier, then it does with anything remarkable about these three, In fact, last year, Public Schools lost 9 points and 4 positions in rank. This year it lost another four points but rose 4 tanks.
Figure 2 - Confidence in U.S. Institutions - 2020 Bottom Tier
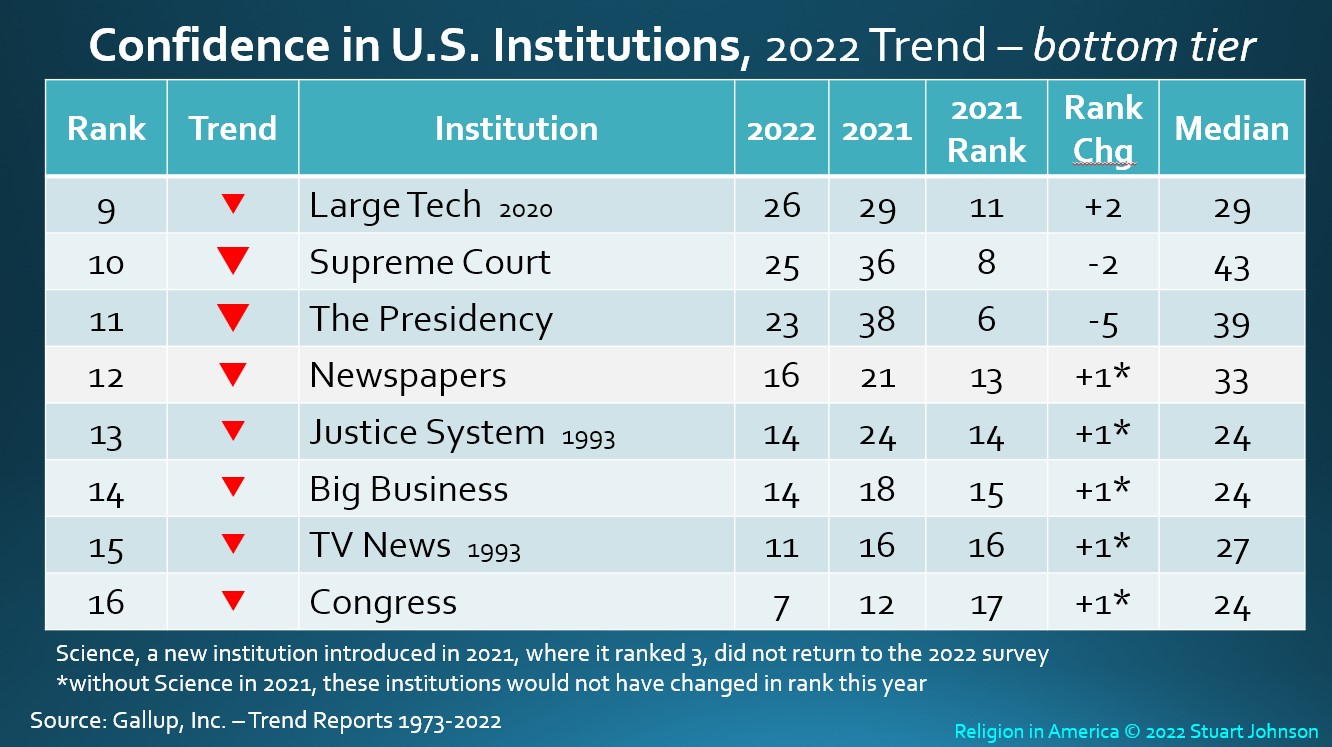
The reason for the some of the gains in the top tier are directly related to the dramatic fall of the Supreme Court and The Presidency since 2021.
The 2022 survey was conducted as the Supreme Court neared announcement of its decision impacting Roe vs. Wade, a situation fueled by weeks of speculation and coverage stoking public opinion against the anticipated decision following the leak of a first draft opinion by Associate Justice Samuel Alitto, . (The source of the leak has not been determined as of this writing nor has there been much media interest in pursuing the impact of such a leak on the deliberative process within the court). The result: an 11-point drop in confidence to an all-tme low of 25, and a drop of two places in rank from 2021.
Looking at the demographic breakdown, party and ideology identification were far more significant than gender, race, age, or education. By party identification:weighted party identity was 27% each for Republicans and Democrats, 43% Independent. Identification as Conservative, Moderate or Liberal followed party ID very closely. This means that Independents/Moderates had greater influence than either Republican/Conservatives and Democrats/Liberals.
- "Some" were equally split between Republicans (46%), Independents (44%) and Democrats (44%). It is at the extremes that the differences are apparent:
- Confident ("A Great Deal"/"Quite a Lot"): Republicans (39%), Independents (25%), Democrats (13%)
- "Very Little": Republicans (17%), Independents (29%), Democrats (45%)
The Presidency suffered an even more significant drop, with a loss of 15 points in confidence and a drop of five places in rank since mid-2021—months into the new administration of Joe Biden—as COVID continued to dampen national spirit as inflation rose to levels not seen since Jimmy Carter occupied the Oval Office. The institution is called "The Presidency" rather than "The President," an important distinction, but not enough to make it immune from focus on the current president.
While other demographic factors showed a bit more variance than for the Supreme Court, it was party ID that showed the greatest differences.
- Confident ("A Great Deal"/"Quite a Lot"): Republicans 2%), Independents (18%), Democrats (51%)
- "Some": Republicans (11%), Independents (32%) and Democrats (41%).
- "Very Little": Republicans (77%), Independents (48%), Democrats (8%)
Unlike the Supreme Court, where ideology and party ID were close, on The Presidency the breakdown by ideology is still significant but less extreme:
- Confident ("A Great Deal"/"Quite a Lot"): Conservatives (8%), Moderates (26%), Liberals (40%)
- "Some": Conservatives (14%), Moderates (36%), Liberals (38%)
- "Very Little": Conservatives (70%), Moderates (36%), Liberals (19%)
Comparing 2022 to High and Median Scores
Figure 3 - Confidence in U.S. Institutions - 2022 Compared to High Score

Except for Science, new to the list in 2021, the scores for the other 16 institutions in 2021 were all below their highest score. Last year, Small Business and The Medical System reached their high scores during the early months of the COVID-19 pandemic. This year, both are down (5 and 7 points respectively). The Military also gained in 2020, but its high score of 1985 occurred during the first Gulf War in 1991 (see charts below for more perspective on history of high and low scores). Large Tech was introduced in 2020, so the fact is started at its high is not very significant, but simply follows the pattern of decline in 2021.
The Presidency has fallen the most; 34 points to 38. It was 72 when added to the list in 1991 during the first Gulf War, with George H. W. Bush in the White House (that year also marked the high point for The Military). Falling 30 points from their highs were Public Schools, Newspapers, TV News, and Congress. Organized Religion is next, down 29 points from its high of 68 in 1975, followed by Banks, down 27 points.
Eleven of the institutions had majority confidence when they hit their high. By 2021 that had fallen to only four: Small Business, The Military, and Science all with a comfortable margin and The Police by one point.
Figure 4 - Confidence in U.S. Institutions - 2021 Compared to Median Scores
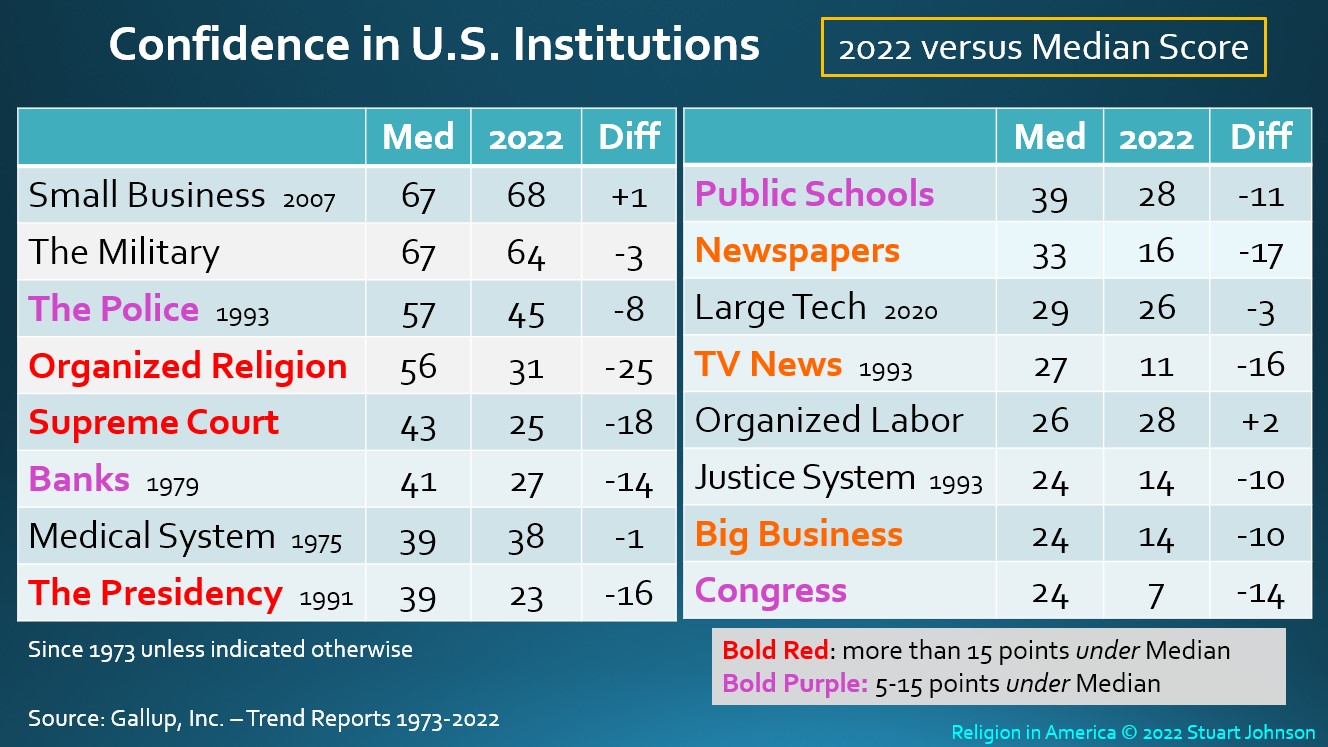
The Median represents the mid-point in Scores for each institution (while usually close in this survey, I prefer median because an average can be skewed by extreme high or low scores).
With a general decline in confidence over the years it would be expected that current scores be below the Median. But there are a few exceptions.
In 2021 four institutions were above their median. After a big boost in 2020, the Medical System in 2021 remained 5 points above its median, with Small Business and The Military both 3 points above and Organized Labor with a 2 point margin.
Organized Religion had the largest gap, at 19 points below its median of 56, and Congress is 12 points below its median of 24. Both have been on the survey list for 49 years, since its inception in 1973. That is a point of interest, but not causation. The seven institutions below their medians by 6 to 10 points have been on the list from 29 to 49 years.
While eleven institutions had High scores with majority confidence, only five had Median scores representing majority confidence.
Distribution of Responses
The charts and tables used elsewhere in this report use the confidence "Score," the sum of Great Deal and Quite a Lot reposes. With declining confidence levels over time, I began to wonder about the breakdown of responses by institution, primarily to see if there have been shifts over time toward Quite a Lot and Some. While Some can be interpreted as a sign of uncertainty, it does express as its name implies some degree of confidence. So, for this update I added the following charts as well as Part 2 of this Digging Deeper section to probe the distribution of responses. The charts that follow show all five levels of response, but highlight key ones. Fig. 5 for example highlights the traditional Score components, Great Deal and Quite a Lot. Fig. 6 also highlights Some to see if it adds a demonstrable impact.
Figure 5 - Confidence by Score - 2021
![]()
Here, we see the 2021 results broken down by response, with Score components highlighted. Look at the division between Great Deal and Quite a Lot. For Small Business it is even, for Military and Science (new to the list), it leans toward Great Deal. The Police and Organized Religion are nearly even, otherwise the rest of the list softens, with more emphasis on Quite a Lot. In addition, only the first four have majority Scores. That made me want to look closer at what happens if we include Some.
Figure 6 - Confidence, with "Some" - 2021
![]()
By including "Some" and resorting the list on the total of the three responses, five of the 17 institutions in 2021 move up in rank. Except for Congress at the bottom, the other four are the only institutions with Some reposes over 40. That also shifts the balance. For the first three ranks, Some is smaller than either Great Deal or Quite a Lot. For The Police, Some is less than Score (Great Deal + Quite a Lot). But for Supreme Court and the four others that would move up in rank, Some is greater than Score. And the influence of Some increases as you go down in rank. For Supreme Court, Some accounts for 54% of the total of the three highlighted responses. For Congress, Some is 76% of the three combined.
Even with the inclusion of Some, Congress and TV News are still below majority confidence. For the top 10, the confidence level, including Some, is 70% and higher.
Historic High Confidence
In the following charts, I return to the use of Score, the sum of Great Deal and Quite a Lot, but look across the history of the Gallup confidence survey, with the original eight institutions going back to 1973 and others added since then. The dates noted in these charts refer to the year of an institution's high or low score.
Figure 7 - Confidence by Historic High Score
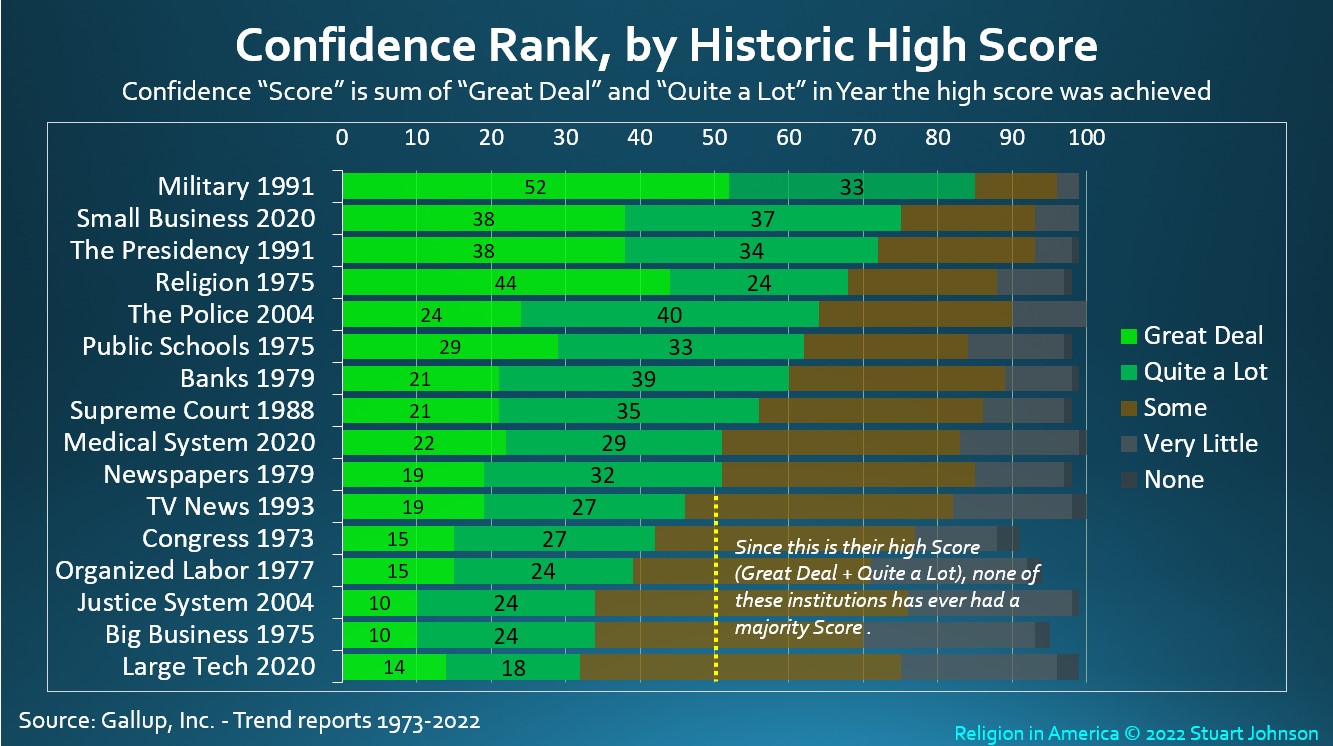
Here, the responses are shown for the year in which the institution achieved its highest Score. 8 of the 17 did not receive majority confidence, even in the year with their highest score.
In the split between Great Deal and Quite a Lot, The Military, Organized Religion and Science leaned toward Great Deal; a few were closer to an even split; and the rest leaned toward Quite a Lot, particularly in the bottom half of rankings. The bottom six never reached majority confidence (by Score) in their time on the list of institutions.
Figure 8 - Confidence by Year of Historic High Score
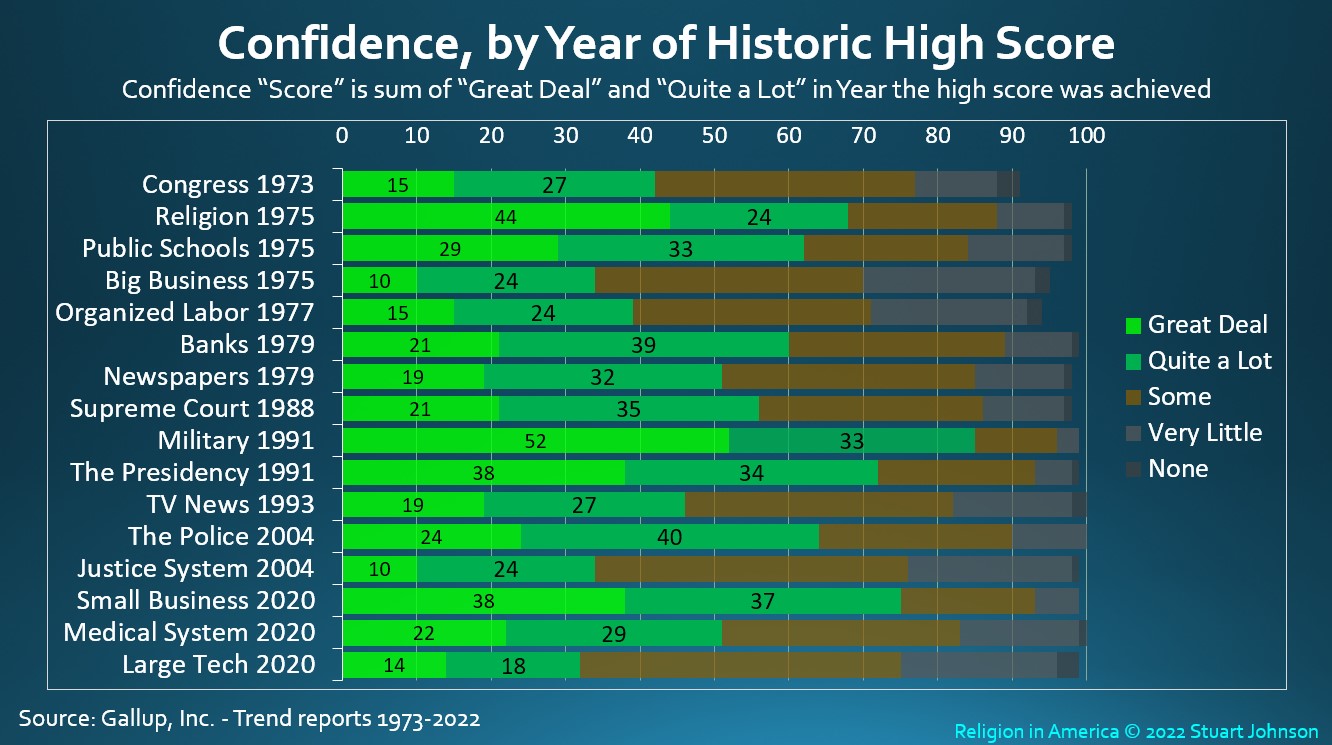
Sorting the Historic High list by the year in which the High score was achieved reveals more connection to events than any discernible pattern over time. An obvious example is the combination of The Military and The Presidency, which both hit their high marks during the first Gulf War in 1991. In fact, The Presidency was added to Gallup's list that year, with George H. W. Bush in the White House.
Similarly, the Highs for Small Business and The Medical System came in 2020 at the beginning of the COVID-19 pandemic and the emphasis on honoring "heroes." Large Tech was added in 2020 with a higher score than it would show for 2021and a ranking in the bottom half. It appears its inclusion was prompted by negative attention, unlike the introduction of Science in 2021, which received a lot of positive attention during the pandemic, debuting at number 3.
Historic Low Confidence
Figure 7 - Confidence by Historic Low Score
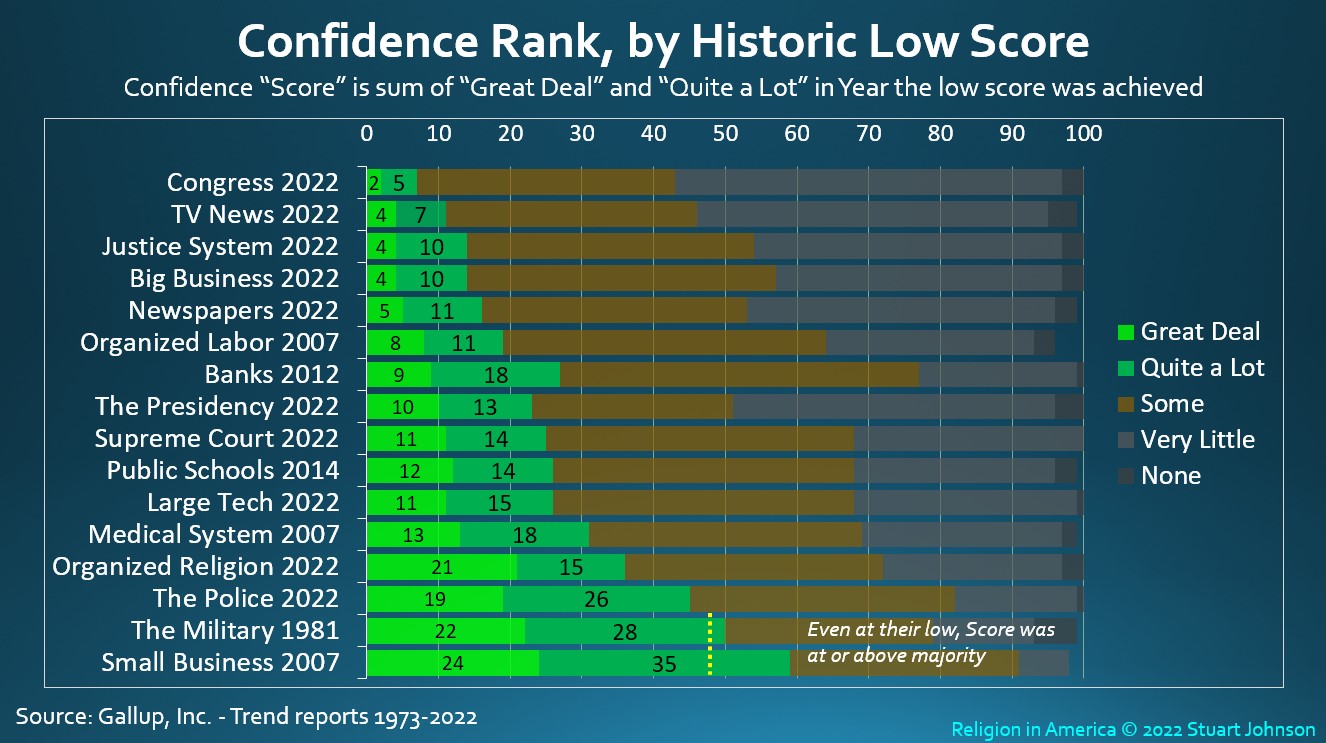
Large Tech and Science are not included here because of their recent introductions to the list of institutions.
Not surprisingly, 13 of the 15 institutions leaned toward Quite a Lot over Great Deal. For Congress, which had the lowest Low Score, Great Deal contributed one point more than Quite a Lot. For Organized Religion the spread was 6 points, which could indicate that those who retain confidence in the institution have a higher level of commitment than is found in other institutions at their low point.
Figure 8 - Confidence by Year of Historic Low Score
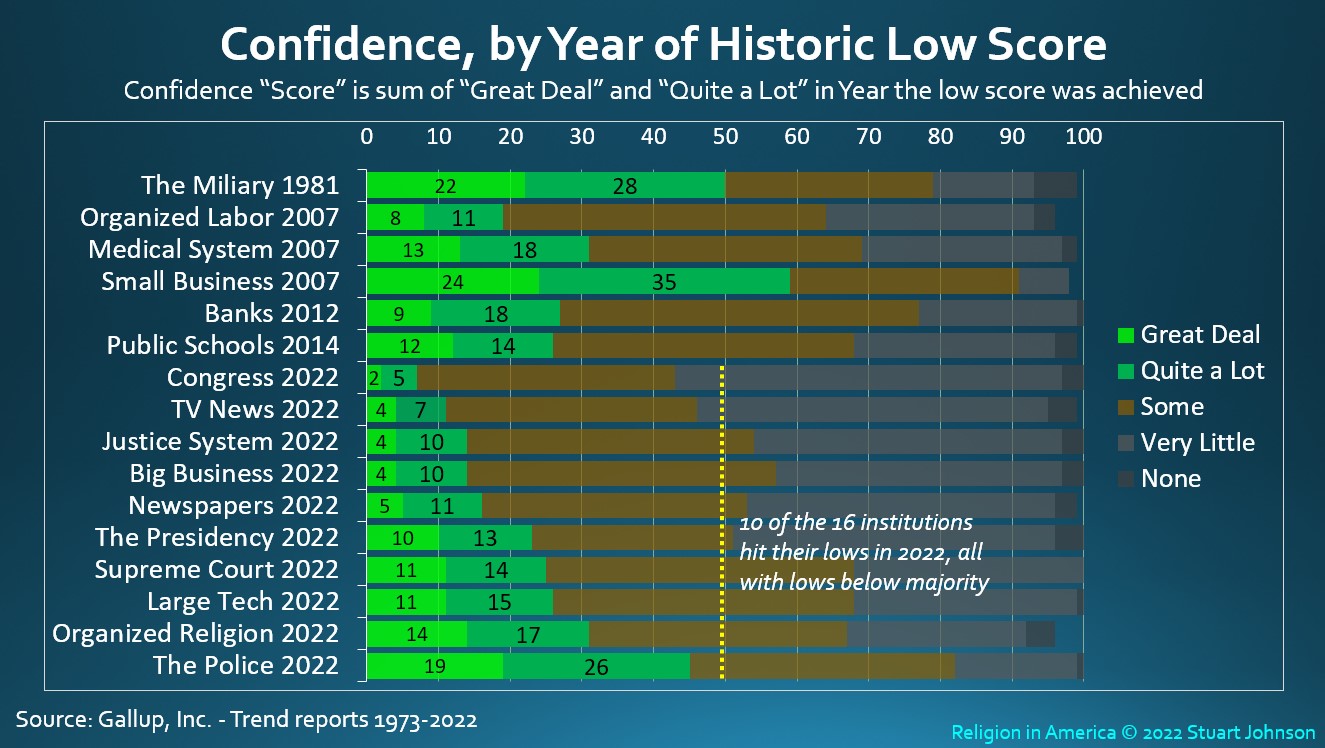
As confidence in general has declined, the contrast between the timelines for High and Low Scores should not be surprising. 11 of the 17 institutions in the 2021 survey reached their High Score before 2000, another two before 2005. Except for Large Tech and Science, which are not included here, all but two of the longer-running institutions hit their Low Score in 2007 or later. While the Criminal Justice System has been among institutions with the lowest confidence levels, its Low point was back in 1994 and its High point ten years later in 2004 (See Part 2 of this Digging Deeper section to see the timeline of survey responses for each institution—follow the link at the top of this page).
A mix of four institutions hit their Low in 2007, the end of George W. Bush's second term, even before the Great Recession of 2008-09 became official: Small Business, The Medical System, The Presidency and Organized Labor. Banks would follow with its Low Score of 21 in 2012. Three institutions saw their Low in 2014, prior to the mid-term elections in Barack Obama's second term: The Supreme Court, Public Schools and Congress.
News reporting has steadily declined, with Newspapers reaching its Low of 20 in 2016 and TV News at 16 in 2021. Social Media is best represented by Large Tech, introduced to the list in 2020 with a Score of 32, which declined to 29 in 2021. Because Large Tech represents more than its news function, it is difficult to make a direct comparison with Newspapers and TV News, but it is clear that Large Tech is in the lower tier of confidence.
Organized Religion hit is low in 2019 and The Police in 2020, but both have rebounded slightly.
Since the delta variant—and any others that may emerge—is making the end of the COVID-19 pandemic uncertain, it is difficult to project institutional confidence other than to look at its long-term and general decline.
Religion in America
Digging Deeper: Confidence Part 1 (Overview)
Part 2 (NEW) —Demographic breakdown for each institution.
Part 3—Historic timeline charts tracking survey results for each institution (except Large Tech, which has only been in the survey three years, so more time is needed to develop its history).
updated August 31, 2022
< back to Religion in America summary
Summary
The following charts provide additional detail for the Gallup survey of Confidence in U.S. Institutions. Gallup began this survey in 1973, asking people about their confidence in 15 major institutions. Over the years, the number has varied between 15 and 17 (those added since 1973 are indicated in brackets on the charts in the Summary page).
The Details
Browse the page or click on an item to go directly to that section. "Score" refers to sum of "Great Deal" and "Quite a Lot" of confidence.
- Trend: comparison of 2021 to 2020 and Median Scores
- 2021 Score versus High and Median Scores
- Including "Some" in Breakdown of Responses
- Breakdown of Responses by Historic High
- Breakdown of Responses by Historic Low
2022 Trends
Figure 1 - Confidence in U.S. Institutions - 2022 Top Tier
The confidence "Score" is the percentage of respondents indicating a "great deal" or "quite a lot" of confidence in an institution (compared to those expressing "some," "very little," or "none"). The arrow indicates the direction of change from 2020, with the size of the arrow signifying relative magnitude of the change.
Last year we saw confidence levels turn downward again after 10 of 16 took an unusual upward turn in 2020, which I attributed to a positive feeling toward those institutions as they responded during the early days of the COVID-19 pandemic. A year later COVID fatigue had set in and while some institutions remained elevated in rank, all 16 of those surveyed in 2021 declined. By 2022, COVID was still here, but while still official labeled a pandemic, it began to feel more like an endemic, with widespread but relatively mild symptoms for those who have been vaccinated and boosted. Whether related to ongoing fatigue and growing malaise or simply a resumption of the downward trend in confidence, all but one (Organized Labor) went down in 2022, 10 of the 16 to record low confidence levels.
The upward movement in rank was caused by Gallup's introduction of Science as an institution in 2021, at rank 3, which pushed all the remaining institutions down at least one rank. Science was not used again in 2022, so all of those changing rank by +1 were simply returning to where they would have been. This included 8 of the 16 institutions in the 2022 survey.
The Medical System, which was propelled from number 7 in 2019 to number 3 in 2020, with a 15 point increase in confidence, settled back in 2021, losing 7 points and dropping two ranks to number 5, then losing another 6 points in 2022, but moving up to number 4 (helped by the absence of Science).
Organized Religion recovered in ranking, moving up to number 5, but lost six points, falling to its all-time low confidence score of 31.
The upward movement in ranking for Organized Religion, Public Schools and Organized Labor has more to do with the downward movement institutions that moved into the bottom tier, then it does with anything remarkable about these three, In fact, last year, Public Schools lost 9 points and 4 positions in rank. This year it lost another four points but rose 4 tanks.
Figure 2 - Confidence in U.S. Institutions - 2020 Bottom Tier
The reason for the some of the gains in the top tier are directly related to the dramatic fall of the Supreme Court and The Presidency since 2021.
The 2022 survey was conducted as the Supreme Court neared announcement of its decision impacting Roe vs. Wade, a situation fueled by weeks of speculation and coverage stoking public opinion against the anticipated decision following the leak of a first draft opinion by Associate Justice Samuel Alitto, . (The source of the leak has not been determined as of this writing nor has there been much media interest in pursuing the impact of such a leak on the deliberative process within the court). The result: an 11-point drop in confidence to an all-tme low of 25, and a drop of two places in rank from 2021.
Looking at the demographic breakdown, party and ideology identification were far more significant than gender, race, age, or education. By party identification:weighted party identity was 27% each for Republicans and Democrats, 43% Independent. Identification as Conservative, Moderate or Liberal followed party ID very closely. This means that Independents/Moderates had greater influence than either Republican/Conservatives and Democrats/Liberals.
- "Some" were equally split between Republicans (46%), Independents (44%) and Democrats (44%). It is at the extremes that the differences are apparent:
- Confident ("A Great Deal"/"Quite a Lot"): Republicans (39%), Independents (25%), Democrats (13%)
- "Very Little": Republicans (17%), Independents (29%), Democrats (45%)
The Presidency suffered an even more significant drop, with a loss of 15 points in confidence and a drop of five places in rank since mid-2021—months into the new administration of Joe Biden—as COVID continued to dampen national spirit as inflation rose to levels not seen since Jimmy Carter occupied the Oval Office. The institution is called "The Presidency" rather than "The President," an important distinction, but not enough to make it immune from focus on the current president.
While other demographic factors showed a bit more variance than for the Supreme Court, it was party ID that showed the greatest differences.
- Confident ("A Great Deal"/"Quite a Lot"): Republicans 2%), Independents (18%), Democrats (51%)
- "Some": Republicans (11%), Independents (32%) and Democrats (41%).
- "Very Little": Republicans (77%), Independents (48%), Democrats (8%)
Unlike the Supreme Court, where ideology and party ID were close, on The Presidency the breakdown by ideology is still significant but less extreme:
- Confident ("A Great Deal"/"Quite a Lot"): Conservatives (8%), Moderates (26%), Liberals (40%)
- "Some": Conservatives (14%), Moderates (36%), Liberals (38%)
- "Very Little": Conservatives (70%), Moderates (36%), Liberals (19%)
Comparing 2022 to High and Median Scores
Figure 3 - Confidence in U.S. Institutions - 2022 Compared to High Score
Except for Science, new to the list in 2021, the scores for the other 16 institutions in 2021 were all below their highest score. Last year, Small Business and The Medical System reached their high scores during the early months of the COVID-19 pandemic. This year, both are down (5 and 7 points respectively). The Military also gained in 2020, but its high score of 1985 occurred during the first Gulf War in 1991 (see charts below for more perspective on history of high and low scores). Large Tech was introduced in 2020, so the fact is started at its high is not very significant, but simply follows the pattern of decline in 2021.
The Presidency has fallen the most; 34 points to 38. It was 72 when added to the list in 1991 during the first Gulf War, with George H. W. Bush in the White House (that year also marked the high point for The Military). Falling 30 points from their highs were Public Schools, Newspapers, TV News, and Congress. Organized Religion is next, down 29 points from its high of 68 in 1975, followed by Banks, down 27 points.
Eleven of the institutions had majority confidence when they hit their high. By 2021 that had fallen to only four: Small Business, The Military, and Science all with a comfortable margin and The Police by one point.
Figure 4 - Confidence in U.S. Institutions - 2021 Compared to Median Scores
The Median represents the mid-point in Scores for each institution (while usually close in this survey, I prefer median because an average can be skewed by extreme high or low scores).
With a general decline in confidence over the years it would be expected that current scores be below the Median. But there are a few exceptions.
In 2021 four institutions were above their median. After a big boost in 2020, the Medical System in 2021 remained 5 points above its median, with Small Business and The Military both 3 points above and Organized Labor with a 2 point margin.
Organized Religion had the largest gap, at 19 points below its median of 56, and Congress is 12 points below its median of 24. Both have been on the survey list for 49 years, since its inception in 1973. That is a point of interest, but not causation. The seven institutions below their medians by 6 to 10 points have been on the list from 29 to 49 years.
While eleven institutions had High scores with majority confidence, only five had Median scores representing majority confidence.
Distribution of Responses
The charts and tables used elsewhere in this report use the confidence "Score," the sum of Great Deal and Quite a Lot reposes. With declining confidence levels over time, I began to wonder about the breakdown of responses by institution, primarily to see if there have been shifts over time toward Quite a Lot and Some. While Some can be interpreted as a sign of uncertainty, it does express as its name implies some degree of confidence. So, for this update I added the following charts as well as Part 2 of this Digging Deeper section to probe the distribution of responses. The charts that follow show all five levels of response, but highlight key ones. Fig. 5 for example highlights the traditional Score components, Great Deal and Quite a Lot. Fig. 6 also highlights Some to see if it adds a demonstrable impact.
Figure 5 - Confidence by Score - 2021
![]()
Here, we see the 2021 results broken down by response, with Score components highlighted. Look at the division between Great Deal and Quite a Lot. For Small Business it is even, for Military and Science (new to the list), it leans toward Great Deal. The Police and Organized Religion are nearly even, otherwise the rest of the list softens, with more emphasis on Quite a Lot. In addition, only the first four have majority Scores. That made me want to look closer at what happens if we include Some.
Figure 6 - Confidence, with "Some" - 2021
![]()
By including "Some" and resorting the list on the total of the three responses, five of the 17 institutions in 2021 move up in rank. Except for Congress at the bottom, the other four are the only institutions with Some reposes over 40. That also shifts the balance. For the first three ranks, Some is smaller than either Great Deal or Quite a Lot. For The Police, Some is less than Score (Great Deal + Quite a Lot). But for Supreme Court and the four others that would move up in rank, Some is greater than Score. And the influence of Some increases as you go down in rank. For Supreme Court, Some accounts for 54% of the total of the three highlighted responses. For Congress, Some is 76% of the three combined.
Even with the inclusion of Some, Congress and TV News are still below majority confidence. For the top 10, the confidence level, including Some, is 70% and higher.
Historic High Confidence
In the following charts, I return to the use of Score, the sum of Great Deal and Quite a Lot, but look across the history of the Gallup confidence survey, with the original eight institutions going back to 1973 and others added since then. The dates noted in these charts refer to the year of an institution's high or low score.
Figure 7 - Confidence by Historic High Score
Here, the responses are shown for the year in which the institution achieved its highest Score. 8 of the 17 did not receive majority confidence, even in the year with their highest score.
In the split between Great Deal and Quite a Lot, The Military, Organized Religion and Science leaned toward Great Deal; a few were closer to an even split; and the rest leaned toward Quite a Lot, particularly in the bottom half of rankings. The bottom six never reached majority confidence (by Score) in their time on the list of institutions.
Figure 8 - Confidence by Year of Historic High Score
Sorting the Historic High list by the year in which the High score was achieved reveals more connection to events than any discernible pattern over time. An obvious example is the combination of The Military and The Presidency, which both hit their high marks during the first Gulf War in 1991. In fact, The Presidency was added to Gallup's list that year, with George H. W. Bush in the White House.
Similarly, the Highs for Small Business and The Medical System came in 2020 at the beginning of the COVID-19 pandemic and the emphasis on honoring "heroes." Large Tech was added in 2020 with a higher score than it would show for 2021and a ranking in the bottom half. It appears its inclusion was prompted by negative attention, unlike the introduction of Science in 2021, which received a lot of positive attention during the pandemic, debuting at number 3.
Historic Low Confidence
Figure 7 - Confidence by Historic Low Score
Large Tech and Science are not included here because of their recent introductions to the list of institutions.
Not surprisingly, 13 of the 15 institutions leaned toward Quite a Lot over Great Deal. For Congress, which had the lowest Low Score, Great Deal contributed one point more than Quite a Lot. For Organized Religion the spread was 6 points, which could indicate that those who retain confidence in the institution have a higher level of commitment than is found in other institutions at their low point.
Figure 8 - Confidence by Year of Historic Low Score
As confidence in general has declined, the contrast between the timelines for High and Low Scores should not be surprising. 11 of the 17 institutions in the 2021 survey reached their High Score before 2000, another two before 2005. Except for Large Tech and Science, which are not included here, all but two of the longer-running institutions hit their Low Score in 2007 or later. While the Criminal Justice System has been among institutions with the lowest confidence levels, its Low point was back in 1994 and its High point ten years later in 2004 (See Part 2 of this Digging Deeper section to see the timeline of survey responses for each institution—follow the link at the top of this page).
A mix of four institutions hit their Low in 2007, the end of George W. Bush's second term, even before the Great Recession of 2008-09 became official: Small Business, The Medical System, The Presidency and Organized Labor. Banks would follow with its Low Score of 21 in 2012. Three institutions saw their Low in 2014, prior to the mid-term elections in Barack Obama's second term: The Supreme Court, Public Schools and Congress.
News reporting has steadily declined, with Newspapers reaching its Low of 20 in 2016 and TV News at 16 in 2021. Social Media is best represented by Large Tech, introduced to the list in 2020 with a Score of 32, which declined to 29 in 2021. Because Large Tech represents more than its news function, it is difficult to make a direct comparison with Newspapers and TV News, but it is clear that Large Tech is in the lower tier of confidence.
Organized Religion hit is low in 2019 and The Police in 2020, but both have rebounded slightly.
Since the delta variant—and any others that may emerge—is making the end of the COVID-19 pandemic uncertain, it is difficult to project institutional confidence other than to look at its long-term and general decline.
©2026 Stuart Johnson & Associates
Resouce Center | Contact Us
©2026 Stuart Johnson & Associates