
Making Information Make Sense
Religion in America
Digging Deeper: Composition
updated June 28, 2021
< back to Religion in America summary
Summary
Gallup has asked people their overall religious affiliation over a long period of time. Figure 1 in the Details below shows the "rise of the nones," with those claiming no affiliation growing 10-fold between 1948 and 2020, from 2% to 20%. Catholics remained steady at 22%, while Other Religions more than doubled, from 4 to 9 percent. That left Other Christian in significant decline, from 69% in 1948 to 46% in 2020. (Pew reports a much higher level of Unaffiliated. See the note below for comments about that).
Pew Research Center has asked people about their identification with religious traditions (Catholic, Other Christian, Other Religions, and Unaffiliated), along several demographic factors. Data are available on a nearly annual basis from 2007 through 2018/19*, focusing on the same breakdown as that for Attendance at religion services found in another Digging Deeper page.:
- Gender -Catholics and Other Religions are evenly divided between Men and Women. Other Christian favors Women, while more Men than Women are Unaffiliated. .
- Race - Nearly half of Whites are Other Christian, while just over a quarter consider themselves Unaffiliated. Two-thirds of Blacks are Other Christian, while two in ten are Unaffiliated. Nearly half of Hispanics are Catholic, with the other half are divided nearly equally between Other Christian and Unaffiliated.
- Age Cohort - Most obvious here is that two-thirds of Silents (born 1928-1945) identify as Other Christian, followed by half of Baby Boomers (1946-1964). For Generation X (1965-1980), this drops to four in ten (44%), with the others basically divided between Catholic (22%) and Unaffiliated (25%). The largest group of Millennials (1980-1996) are Unaffiliated (40%), with only 35% Other Christian—half the proportion of Silents.
- Geographic Region - For Catholics, the largest representation comes from the Northeast. Other Christian finds its largest share coming from the Midwest and South. Other Religions is favored by the Northeast and Unaffiliated by the West.
- Education - Comparatively speaking, differences are relatively small, but those with No College have the largest share of Catholic and Other Christian. Those with at least some College education represent the largest share of Other Religions and Unaffiliated.
- Political Party Preference - Catholics are evenly split between Republican and Democratic party preference. Other Christian finds Republicans far ahead of Democrats (60% to 36%). Democrats are double their Republican counterparts in Other Religions (9% to 4%) and Unaffiliated (34% to 16% ).
*For simplicity, this will be referred to either as "the latest survey" or 2019.
The most significant of the demographic factors as far as variance between constituent groups are Age Cohort, Political Party Preference, and Geographic Region.
The Details
Figure 1 - Rise of the Nones (comparing 1948 with 2020)
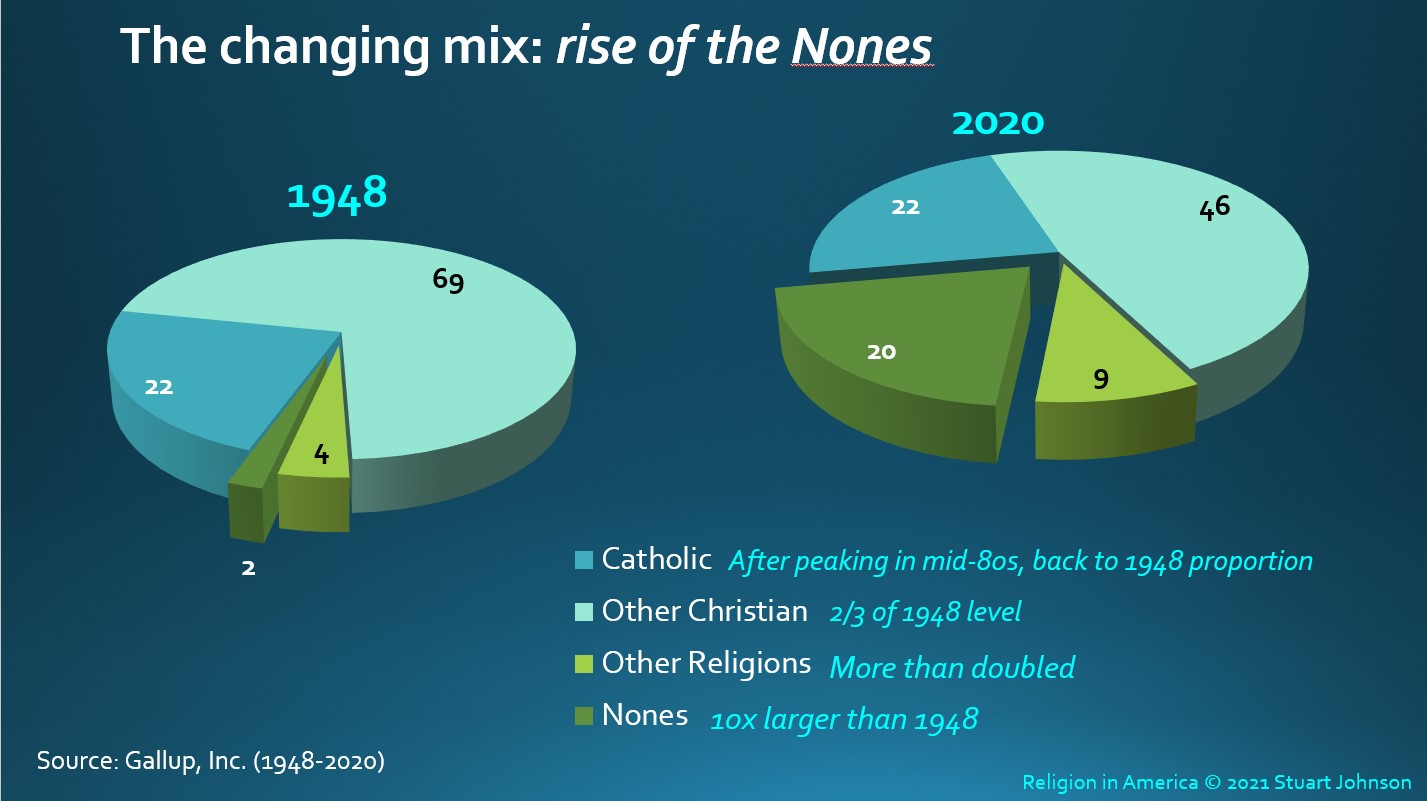
The most striking change in religious affiliation since World War II, and more specifically since the late 1990s, is the "rise of the Nones," those who claim no religious affiliation. In 1948, according to Gallup, Nones comprised 2% of the adult population. The overwhelming majority was Other (non-Catholic) Christian, at 69%. Christians, including Catholics, represented 91% of adults in 1948. Fast forward to 2020, where Christian adherents comprise 68% of the population, still a solid majority, but a drop of 23 points. The change is not as much toward a pluralistic mix of other faiths as it is a rejection of organized religion by a rapidly growing and younger segment of the population.
Catholics, interestingly, started at 22%, peaked in the mid-80s at 29%, went down to 21% in 2018, but ended 2020 back at 22%. So where did all those "Nones" come from? Obviously, Other Christian, which accounts for all of the 23 point drop. Other Religions more than doubled, from 4 to 9 percent, but the biggest change was the "rise of the Nones" from a mere 2% in 1948 to 20% in 2020.
Note: Pew, whose research is the basis of the remaining charts on this page, reports the unaffiliated at 26%, considerably higher than Gallup. Normally one would expect the margin of error to spread across all categories. In fact, except for Unaffiliated, the differences with other categories are within the margin of error (typically 3-4%): Catholic 2% less for Pew, Other Christian 1% less, and Other Religions 2% less, and another 1% difference in Don't Know or no response. It is unusual that margin of error and rounding would all favor one category, but there can also be differences attributed to sample size, reliability of the sample, and even such things as precise wording of survey questions.
As pointed out in other parts of this analysis, initially those who declared themselves unaffiliated simply disavowed organized religion but remained spiritually sensitive (some might be called "seekers"). In fact, for a few years, Pew distinguished between spiritually interested unaffiliated and those with no such interest. As the second decade of the 21st century unfolded, we began to see a rise in those identifying themselves as Agnostic and Atheist, especially among Millennials and those in Generation Z reaching their teen years and moving into adulthood. Some of this is seen in the following section, where charts include a breakdown of the Unaffiliated into Atheist, Agnostic, and Nothing in particular.
In the following charts, the columns represent the latest data from aggregated political studies for 2018/19. The colored bar represents the earliest data from the 2007 Religious Landscape Study (RLS). The RLS has been done in 2007 and 2014. Aggregated political survey results are available from 2009 through 2018/19. (See the detailed tables).
Figure 2 - Religious Affiliation Composition by Gender (2007 vs 2018/19)
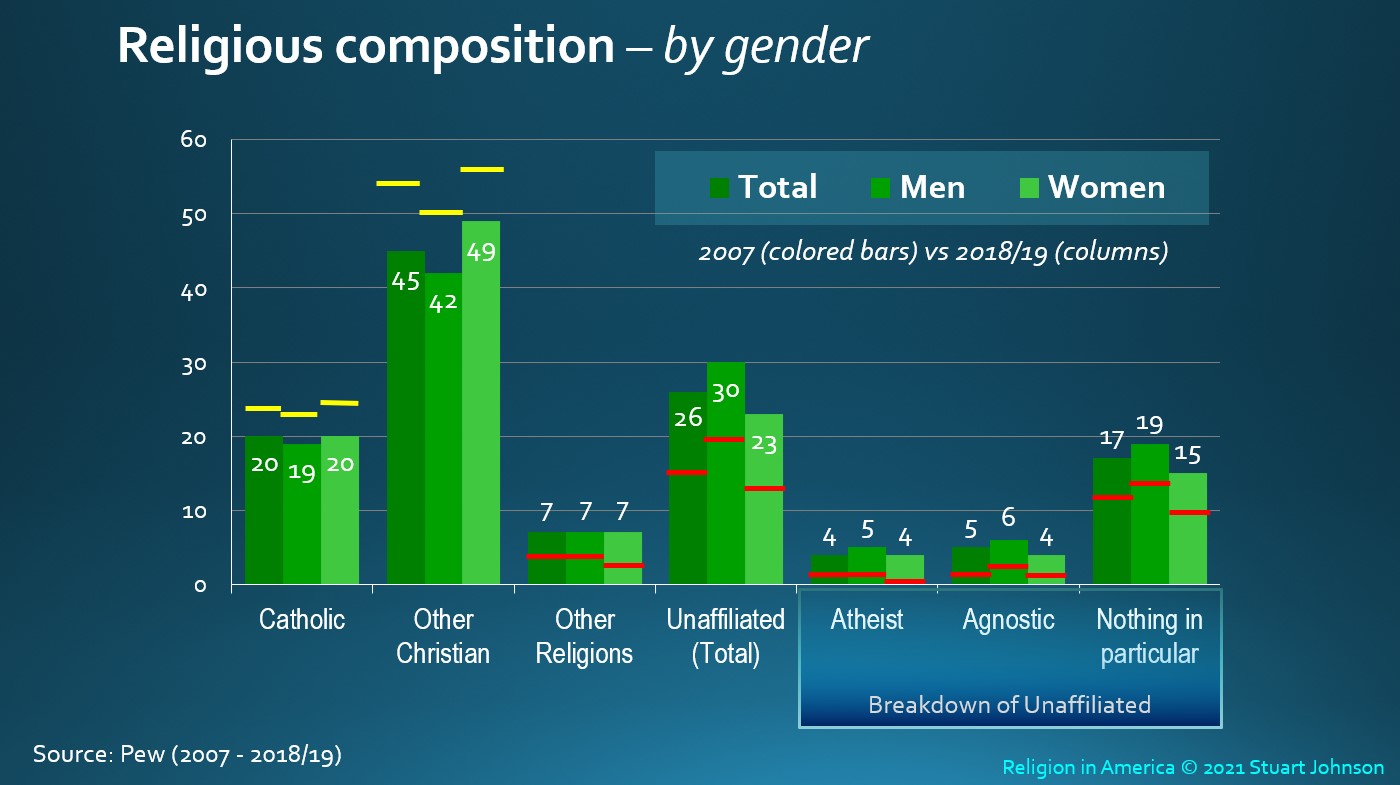
Women claimed Christian affiliation (Catholic + Other Christian) by an 8-point margin over Men at both ends of the timeline and both decreased by 13 points in that time. (Men from 74% to 61%, Women from 82% to 69%). Christian affiliation remains the majority for Men and Women, but it has dropped from around three-quarters of adults to two-thirds. More differences emerge when we look at Catholic versus Other Christian affiliation.
As you can see in the chart, for Catholics and Other Religions, there is little difference between Men and Women. 2007 showed a similar pattern for both, though Catholic has shrunk by 4 points for Men and 5 for Women, while Other Religions has grown by 2 points for Men and 3 for Women..
Other Christians showed a five point advantage for women in the latest survey, but a ten point decline since 2007, dropping to just below the majority threshold.
Three in ten Men (30%) claimed to be Unaffiliated in 2018/19, seven points higher than Women, a ten point gain for both. The difference is spread across the breakdown on Unaffiliated, with Men who claim to be Atheist one point higher than Women, 2 points higher as Agnostic, and 4 points higher as Nothing in particular. While all are higher than 2007, there is little difference in the pattern of distribution between Men and Women between then and 2018/19.
Since the patterns between 2007 and 2018/18 are similar, the main difference is a decline in Catholic and Other Christian adherents coupled with a slight rise in Other Religions and a much larger increase in Unaffiliated, with most of that focused on Nothing in particular. We'll see later how other demographic factors play a larger role in defining the Unaffiliated.
Figure 3 - Religious Affiliation Composition by Race (2007 vs 2018/19)

In the latest survey, 7 in 10 (72%) of Blacks and Hispanics claimed Christian affiliation (Catholic + Other Christian). That is down 13 points from 2007 for Blacks and 12 points for Hispanics. Two-thirds (65%) of Whites declared Christian affiliation, down 13 points since 2007, when Whites were also below Blacks and Hispanics by a similar margin as the latest survey. As we saw in Gender, the overall pattern for Christian affiliation by Race in the latest survey is similar to 2007, but roughly 12- to 13-points lower—still a majority, but definitely in decline.
Just under half of Whites (46%) identified as Other Christian, an 8 point drop from 2007. Fewer than two in ten Whites (17%) identified as Catholic, down 5 points from 2007. There was only a one point increase among Whites for Other Religions since Whites represent the largest bloc of Unaffiliated (27%), up 11 points since 2007.
Only 6% of Blacks identified as Catholic in 2018/19, but that represents a one point gain since 2007. Blacks continue to dominate Other Christian, with a strong majority of 65%, even though that has fallen 14 points since 2007. Blacks have risen 4 points in Other Religions, to 6%. Unaffiliated Blacks have risen 9 points to 21%, with almost all of that increase found in Northing in particular.
Hispanics have dropped from a majority position among Catholics, with 58% claiming that affiliation in 2007 to 47% in the latest survey. Among Other Christian Hispanics stayed virtually unchanged, dropping only one point since 2007 to 25%. Hispanics claim the smallest affiliation with Other Religions, moving up one point to 3%. Unaffiliated Hispanics rose 9 points to 23%, with 2 point gains for both Atheist and Agnostic, and 5 points for Nothing in particular.
Figure 4 - Religious Affiliation Composition by Age Cohort (2007 vs 2018/19)
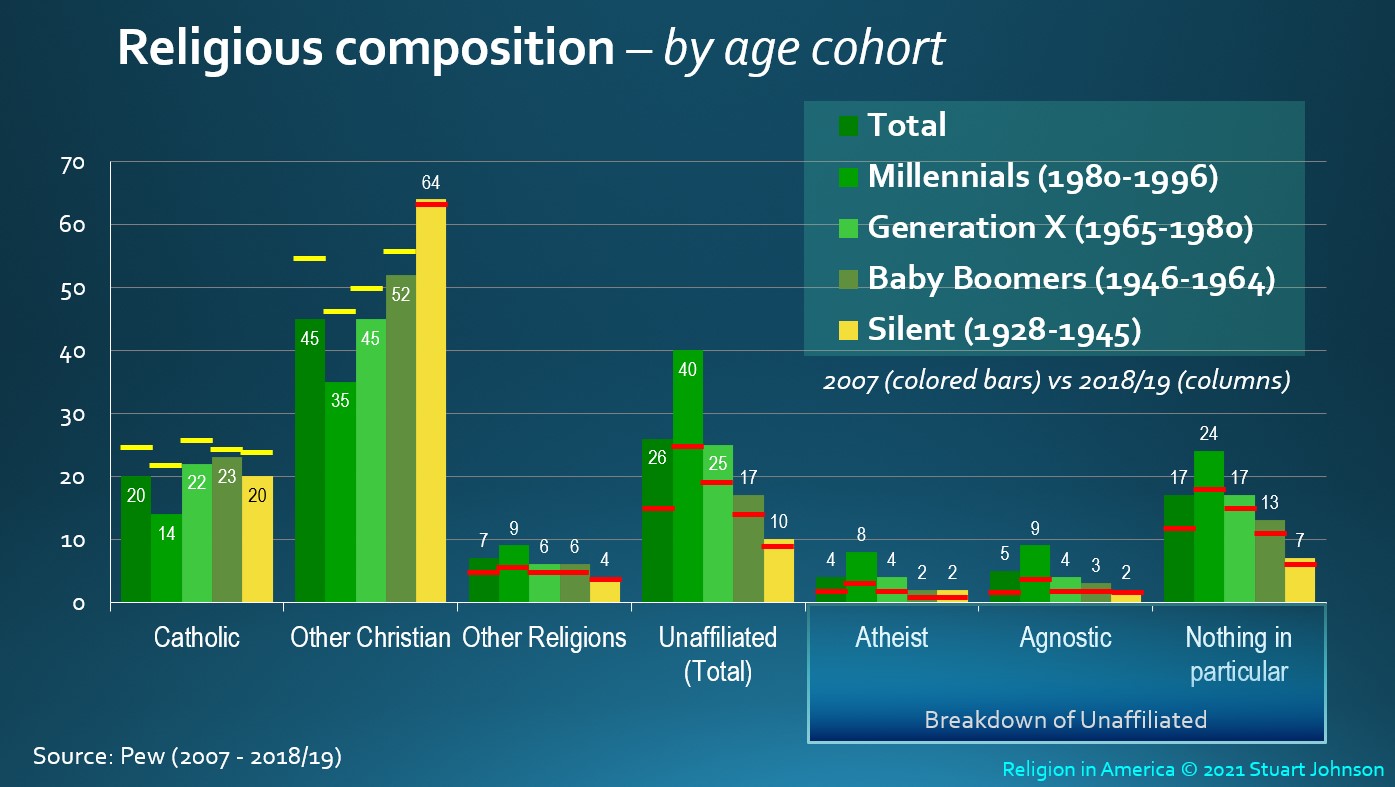
With the exception of Catholic adherents, other groupings show a clear correlation with age. This is seen most clearly by working our way down in age.
Silents (born 1928-1945). Their Christian affiliation started at 87% in 2007 and fell only 3 points to 84% in the latest survey (20% Catholic, 64% Other Christian, with a slight trade-off as Catholic declined and Other Christian actually went up one point, the only instance of an increase in Catholic or Other Christian on any of the charts). Other Religions remained unchanged at 4% and Unaffiliated rose only 1 point to 10%.
Baby Boomers (1945-1964) started seven points below Silents in 2007 (80%), but dropped only 4 points to 76% in the most recent survey, losing more Other Christian than Catholic adherents. Other Religions rose one point to 6%, while Unaffiliated rose a modest 3 points to 17%, spread across Atheist, Agnostic and Nothing in particular.
Generation X (1965-1980) lost nine points, with Christian affiliation dropping from 76% to 67%, increasing the gap with Silents from 11% to 17%. Catholic affiliation went down 4 points to 22%, Other Christian dropped 6 points to 45%. Other Religions rose 1 point to 6%. Unaffiliated rose six points to 25%, two points each for Atheist, Agnostic and Nothing in particular.
Millennials (1981-1996) claiming Christian affiliation started low, with a majority of 68%, but lost 19 points, losing its majority status to end at 49%. That puts Millennials fully 35% below Silents in overall Christian affiliation, nearly doubling the 19% difference in 2007. Catholic affiliation dropped 8 points to 14%, Other Christian lost 11 points, ending at 35%. Other Religions went up 3 points to 9%. Most striking, Unaffiliated increased by 15 points to 40%, a level that shows how the "rise of the Nones" is accelerating among the youngest cohorts (see more on this in a section in the main summary "Introducing Generation Z:). Millennials (and Generation Z) demonstrate what is now called by some the "rise of the Done," with no lingering interest in spirituality, even a growing contempt for religion. Early on as Unaffiliateds began to increase, the dominant choice was Nothing in Particular. With Millennials, the 15-point increase since 2007 is spread evenly between Atheist (from 3% to 8%), Agnostic (from 4% to 9%), and Nothing in particular(from 18% to 24%).
Of all the demographic factors presented by Pew, age cohort should sound alarms for church leaders. We are well past the time when it could be assumed that a loss of interest in religion following college was not uprising and there would be a return to church (or some degree of adherence) with marriage and family. We are now well into the 21st century and all the familiar patterns have changed (age of marriage and family, cohabitation versus marriage, to name just two).
Figure 5 - Religious Affiliation Composition by Region (2007 vs 2018/19)
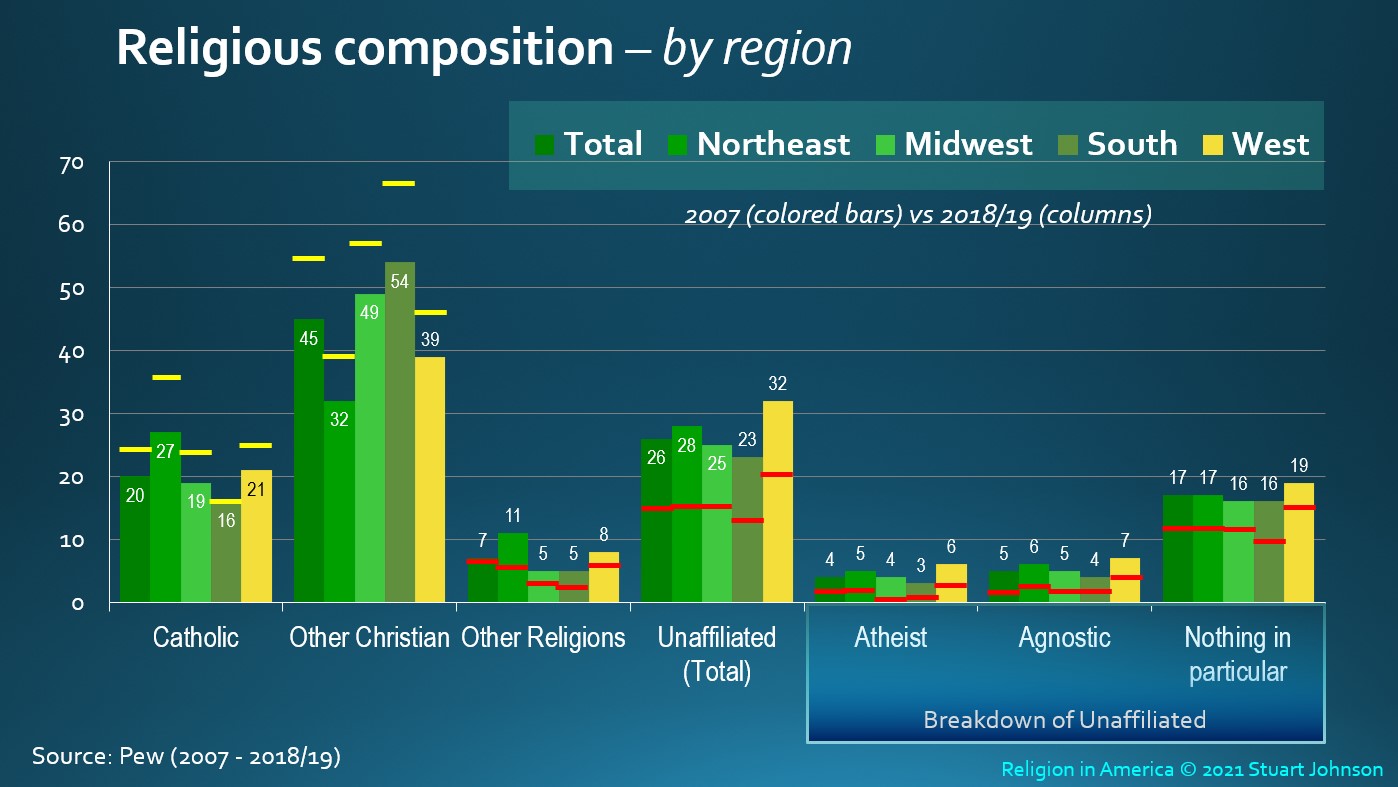
In terms of overall Christian affiliation (Catholic + Other Christian), all regions have declined 11 points or more (the Northeast 17 points) and the differences between regions has narrowed. In 2007, for example, the South was 12 points higher than the West in Christian affiliation (83% versus 71%). In the latest survey, that gap has dropped to 10 points (70% versus 60%), while the Northeast has dropped 17 points to 59%, one point below the West instead of 5 points higher as it was in 2007. The Midwest remains second strongest in Christian affiliation to the South (still within 3 points), but it has dropped 13 points from 80% to 67% and the 9 point gap between the Midwest and Northeast has been reduced to 7 points. Looking at regions by strength of Christian affiliation:
The South
Figure 6 - Religious Affiliation Composition by Education (2007 vs 2018/19)
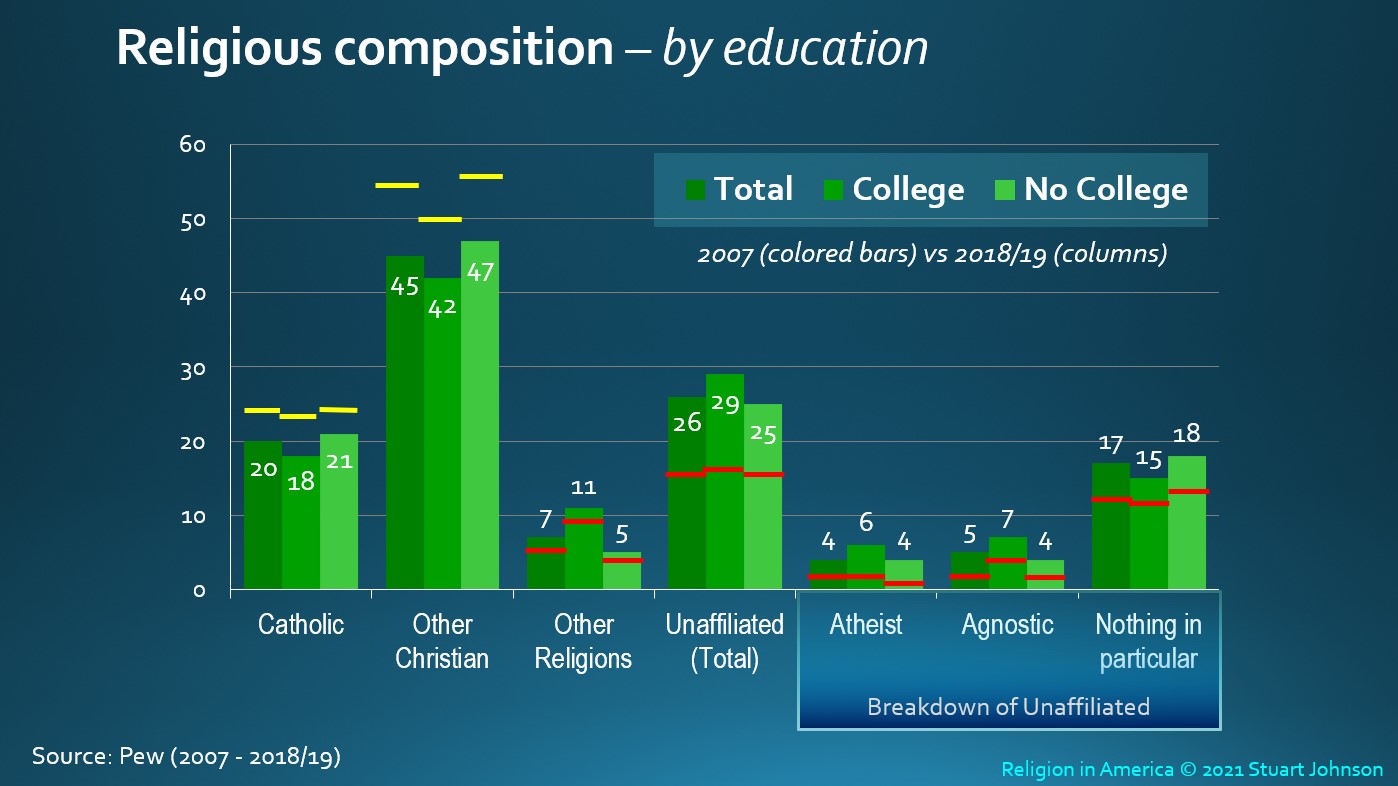
Whether people have any college education is less of a factor in affiliation than one might expect (similar to Attendance at Religious Services).
Both those with and without college education dropped nearly the same from 2007: College educated were down 14 points, from 73% to 59%, No College down 13 points, from 81% to 68%. That increased the gap between them by only 1 point (8 points in 2007, 9 in the latest survey).
Catholic adherents declined in both groups 3-5 points. In 2007 the two groups were within 1 point, 23% for College and 24% for No College. In the latest survey, No College dropped three points to 21%, but those with College education dropped five points to 18%, increasing the spread between them slightly.
The spread for Other Christian narrowed slightly, from 7 points in 2007 to 5 in the latest survey. This is reflected in a larger drop for No College, at 10 points, from 57% to 47%, while those with College dropped 8 points, from 50% to 42%., both faking below the majority threshold.
Other Religions retained the same pattern as 2007, but both groups were up 2 points, with College (11%) double the rate for No College (5%).
Unaffiliated were nearly even in 2007, but College educated pulled ahead of No College by 4 points in the latest survey. While Nothing in particular increased for both groups (4 points for College, 5 points for No College), gains of 2 to 4 points for Atheist and Agnostic produced a more dramatic impact on the chart.
The overall trend seems to be a noticeable acceleration of College educated into Unaffiliated, but Christian (Catholic + Other Christian) still holds a majority.
Figure 6 - Religious Affiliation Composition by Political Preference (2007 vs 2018/19)
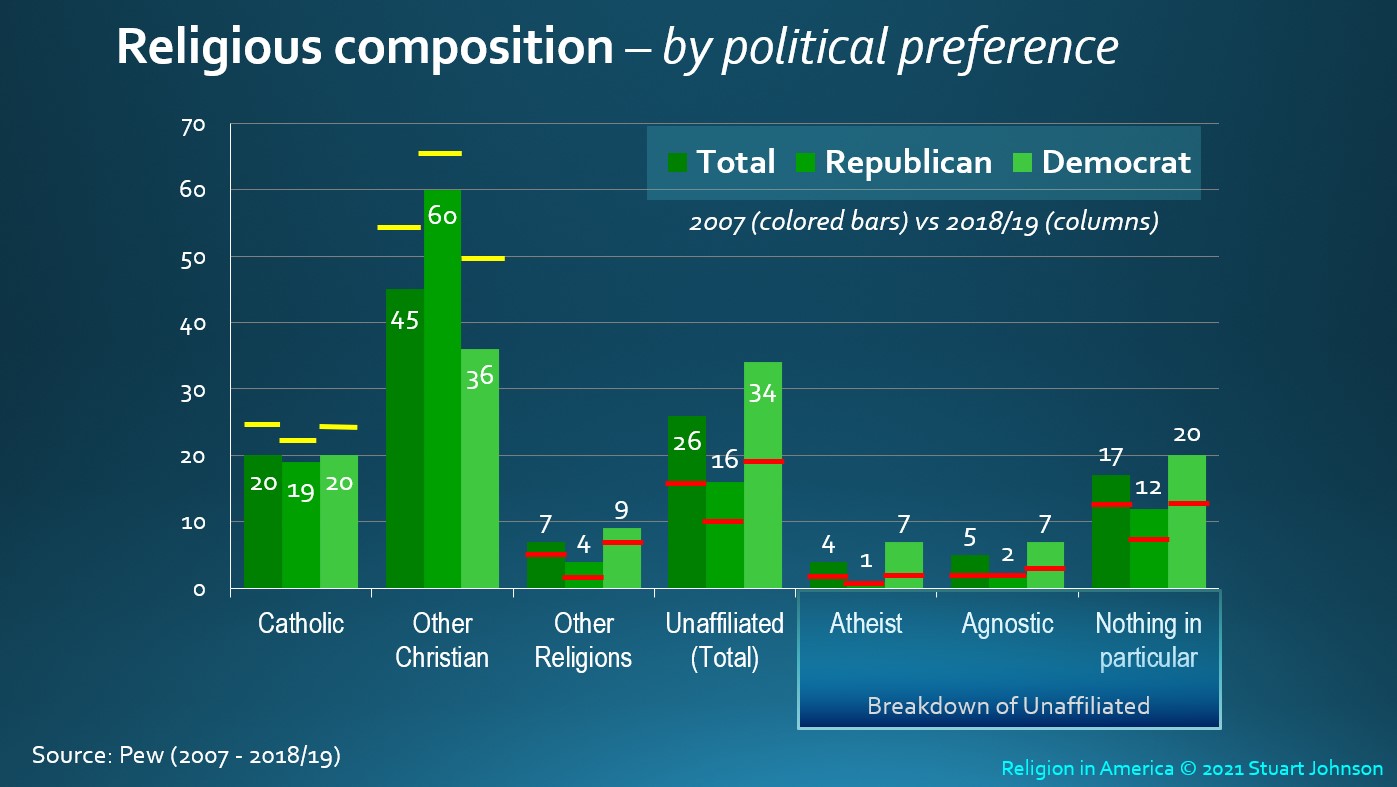
As it did for Attendance at Religious Services, Political Party Preference plays a major role in affiliation.
Those identifying as Republicans or Republican leaning claimed Christian (Catholic + Other Christian) affiliation in 2007, dropping 8 points to 79% in the latest survey. Democrats and those leaning Democratic were 13 points below Republicans in 2007, with 74% claiming Christian affiliation. That dropped by 19 points to 55% in the latest survey and increased the spread to 22 points.
The differences between Catholic and Other Christian are striking (as has been true for other demographics factors). Republicans claiming Catholic affiliation were only 2 points below Democrats in 2007 (22% to 24%). In the latest survey the spread narrowed to one point (19% to 20%), with a modest drop of 2 points for Republicans and 4 points for Democrats.
The overall decline for Other Christian of 10 points between surveys was lopsided, with Republics declining only 5 points and Democrats falling 14 points, from 50% to 36%. Republicans retained a majority position as Other Christian by a still-strong, but declining, margin, while Democrats went from sitting at the 50% majority threshold to 36%, 24 points lower than Republicans.
In this context, it should not be surprising that news reports broadly pointed out the overwhelming support of "evangelicals" for Donald Trump, pushing him to victory in 2016 and retaining loyalty in 2020. Because of the corruption of the term "evangelical," however, I strongly suggest the situation is more nuanced. At the same time, it cannot be denied that the numbers here clearly show a retreat by Democrats from Other Christian affiliation. I discuss in greater detail the problem of the misuse of the term evangelical in the main Summary.
By Political Preference, Other Religions maintained a similar pattern from 2007, increasing 2 points for both Republicans and Democrats.
Unaffiliated increased
10 points since 2007, with Republicans moving up 6 points from 10% to 16%, while Democrats more than doubled that, at 15 points, moving up from 19% to 34%. All of the Republican increase was in Nothing in particular, with Atheist and Agnostic remaining steady at 1% and 2% respectively. Democrats, however, saw a 5 point gain in Atheist, to 7%, a 4 point gain in Agnostic, to 7%, and a 7 point rise in Nothing in particular, to 20%.
Overall, Republicans and Democrats changed little from 2007 in their affiliation as Catholics or Other Religions. The major disparities are a reliably modest decline of Republicans as Other Christian contrasted with a much larger decline of Democrats claiming Other Christian—down to just over a third, nearly matching their rising identification as Unaffiliated. Despite that, those declaring a preference for either party and claiming Christian affiliation (Catholic and Other) still represent a majority, though Democrats are far closer to losing that distinction than are Republicans.
Religion in America
Digging Deeper: Composition
updated June 28, 2021
< back to Religion in America summary
Summary
Gallup has asked people their overall religious affiliation over a long period of time. Figure 1 in the Details below shows the "rise of the nones," with those claiming no affiliation growing 10-fold between 1948 and 2020, from 2% to 20%. Catholics remained steady at 22%, while Other Religions more than doubled, from 4 to 9 percent. That left Other Christian in significant decline, from 69% in 1948 to 46% in 2020. (Pew reports a much higher level of Unaffiliated. See the note below for comments about that).
Pew Research Center has asked people about their identification with religious traditions (Catholic, Other Christian, Other Religions, and Unaffiliated), along several demographic factors. Data are available on a nearly annual basis from 2007 through 2018/19*, focusing on the same breakdown as that for Attendance at religion services found in another Digging Deeper page.:
- Gender -Catholics and Other Religions are evenly divided between Men and Women. Other Christian favors Women, while more Men than Women are Unaffiliated. .
- Race - Nearly half of Whites are Other Christian, while just over a quarter consider themselves Unaffiliated. Two-thirds of Blacks are Other Christian, while two in ten are Unaffiliated. Nearly half of Hispanics are Catholic, with the other half are divided nearly equally between Other Christian and Unaffiliated.
- Age Cohort - Most obvious here is that two-thirds of Silents (born 1928-1945) identify as Other Christian, followed by half of Baby Boomers (1946-1964). For Generation X (1965-1980), this drops to four in ten (44%), with the others basically divided between Catholic (22%) and Unaffiliated (25%). The largest group of Millennials (1980-1996) are Unaffiliated (40%), with only 35% Other Christian—half the proportion of Silents.
- Geographic Region - For Catholics, the largest representation comes from the Northeast. Other Christian finds its largest share coming from the Midwest and South. Other Religions is favored by the Northeast and Unaffiliated by the West.
- Education - Comparatively speaking, differences are relatively small, but those with No College have the largest share of Catholic and Other Christian. Those with at least some College education represent the largest share of Other Religions and Unaffiliated.
- Political Party Preference - Catholics are evenly split between Republican and Democratic party preference. Other Christian finds Republicans far ahead of Democrats (60% to 36%). Democrats are double their Republican counterparts in Other Religions (9% to 4%) and Unaffiliated (34% to 16% ).
*For simplicity, this will be referred to either as "the latest survey" or 2019.
The most significant of the demographic factors as far as variance between constituent groups are Age Cohort, Political Party Preference, and Geographic Region.
The Details
Figure 1 - Rise of the Nones (comparing 1948 with 2020)
The most striking change in religious affiliation since World War II, and more specifically since the late 1990s, is the "rise of the Nones," those who claim no religious affiliation. In 1948, according to Gallup, Nones comprised 2% of the adult population. The overwhelming majority was Other (non-Catholic) Christian, at 69%. Christians, including Catholics, represented 91% of adults in 1948. Fast forward to 2020, where Christian adherents comprise 68% of the population, still a solid majority, but a drop of 23 points. The change is not as much toward a pluralistic mix of other faiths as it is a rejection of organized religion by a rapidly growing and younger segment of the population.
Catholics, interestingly, started at 22%, peaked in the mid-80s at 29%, went down to 21% in 2018, but ended 2020 back at 22%. So where did all those "Nones" come from? Obviously, Other Christian, which accounts for all of the 23 point drop. Other Religions more than doubled, from 4 to 9 percent, but the biggest change was the "rise of the Nones" from a mere 2% in 1948 to 20% in 2020.
Note: Pew, whose research is the basis of the remaining charts on this page, reports the unaffiliated at 26%, considerably higher than Gallup. Normally one would expect the margin of error to spread across all categories. In fact, except for Unaffiliated, the differences with other categories are within the margin of error (typically 3-4%): Catholic 2% less for Pew, Other Christian 1% less, and Other Religions 2% less, and another 1% difference in Don't Know or no response. It is unusual that margin of error and rounding would all favor one category, but there can also be differences attributed to sample size, reliability of the sample, and even such things as precise wording of survey questions.
As pointed out in other parts of this analysis, initially those who declared themselves unaffiliated simply disavowed organized religion but remained spiritually sensitive (some might be called "seekers"). In fact, for a few years, Pew distinguished between spiritually interested unaffiliated and those with no such interest. As the second decade of the 21st century unfolded, we began to see a rise in those identifying themselves as Agnostic and Atheist, especially among Millennials and those in Generation Z reaching their teen years and moving into adulthood. Some of this is seen in the following section, where charts include a breakdown of the Unaffiliated into Atheist, Agnostic, and Nothing in particular.
In the following charts, the columns represent the latest data from aggregated political studies for 2018/19. The colored bar represents the earliest data from the 2007 Religious Landscape Study (RLS). The RLS has been done in 2007 and 2014. Aggregated political survey results are available from 2009 through 2018/19. (See the detailed tables).
Figure 2 - Religious Affiliation Composition by Gender (2007 vs 2018/19)
Women claimed Christian affiliation (Catholic + Other Christian) by an 8-point margin over Men at both ends of the timeline and both decreased by 13 points in that time. (Men from 74% to 61%, Women from 82% to 69%). Christian affiliation remains the majority for Men and Women, but it has dropped from around three-quarters of adults to two-thirds. More differences emerge when we look at Catholic versus Other Christian affiliation.
As you can see in the chart, for Catholics and Other Religions, there is little difference between Men and Women. 2007 showed a similar pattern for both, though Catholic has shrunk by 4 points for Men and 5 for Women, while Other Religions has grown by 2 points for Men and 3 for Women..
Other Christians showed a five point advantage for women in the latest survey, but a ten point decline since 2007, dropping to just below the majority threshold.
Three in ten Men (30%) claimed to be Unaffiliated in 2018/19, seven points higher than Women, a ten point gain for both. The difference is spread across the breakdown on Unaffiliated, with Men who claim to be Atheist one point higher than Women, 2 points higher as Agnostic, and 4 points higher as Nothing in particular. While all are higher than 2007, there is little difference in the pattern of distribution between Men and Women between then and 2018/19.
Since the patterns between 2007 and 2018/18 are similar, the main difference is a decline in Catholic and Other Christian adherents coupled with a slight rise in Other Religions and a much larger increase in Unaffiliated, with most of that focused on Nothing in particular. We'll see later how other demographic factors play a larger role in defining the Unaffiliated.
Figure 3 - Religious Affiliation Composition by Race (2007 vs 2018/19)
In the latest survey, 7 in 10 (72%) of Blacks and Hispanics claimed Christian affiliation (Catholic + Other Christian). That is down 13 points from 2007 for Blacks and 12 points for Hispanics. Two-thirds (65%) of Whites declared Christian affiliation, down 13 points since 2007, when Whites were also below Blacks and Hispanics by a similar margin as the latest survey. As we saw in Gender, the overall pattern for Christian affiliation by Race in the latest survey is similar to 2007, but roughly 12- to 13-points lower—still a majority, but definitely in decline.
Just under half of Whites (46%) identified as Other Christian, an 8 point drop from 2007. Fewer than two in ten Whites (17%) identified as Catholic, down 5 points from 2007. There was only a one point increase among Whites for Other Religions since Whites represent the largest bloc of Unaffiliated (27%), up 11 points since 2007.
Only 6% of Blacks identified as Catholic in 2018/19, but that represents a one point gain since 2007. Blacks continue to dominate Other Christian, with a strong majority of 65%, even though that has fallen 14 points since 2007. Blacks have risen 4 points in Other Religions, to 6%. Unaffiliated Blacks have risen 9 points to 21%, with almost all of that increase found in Northing in particular.
Hispanics have dropped from a majority position among Catholics, with 58% claiming that affiliation in 2007 to 47% in the latest survey. Among Other Christian Hispanics stayed virtually unchanged, dropping only one point since 2007 to 25%. Hispanics claim the smallest affiliation with Other Religions, moving up one point to 3%. Unaffiliated Hispanics rose 9 points to 23%, with 2 point gains for both Atheist and Agnostic, and 5 points for Nothing in particular.
Figure 4 - Religious Affiliation Composition by Age Cohort (2007 vs 2018/19)
With the exception of Catholic adherents, other groupings show a clear correlation with age. This is seen most clearly by working our way down in age.
Silents (born 1928-1945). Their Christian affiliation started at 87% in 2007 and fell only 3 points to 84% in the latest survey (20% Catholic, 64% Other Christian, with a slight trade-off as Catholic declined and Other Christian actually went up one point, the only instance of an increase in Catholic or Other Christian on any of the charts). Other Religions remained unchanged at 4% and Unaffiliated rose only 1 point to 10%.
Baby Boomers (1945-1964) started seven points below Silents in 2007 (80%), but dropped only 4 points to 76% in the most recent survey, losing more Other Christian than Catholic adherents. Other Religions rose one point to 6%, while Unaffiliated rose a modest 3 points to 17%, spread across Atheist, Agnostic and Nothing in particular.
Generation X (1965-1980) lost nine points, with Christian affiliation dropping from 76% to 67%, increasing the gap with Silents from 11% to 17%. Catholic affiliation went down 4 points to 22%, Other Christian dropped 6 points to 45%. Other Religions rose 1 point to 6%. Unaffiliated rose six points to 25%, two points each for Atheist, Agnostic and Nothing in particular.
Millennials (1981-1996) claiming Christian affiliation started low, with a majority of 68%, but lost 19 points, losing its majority status to end at 49%. That puts Millennials fully 35% below Silents in overall Christian affiliation, nearly doubling the 19% difference in 2007. Catholic affiliation dropped 8 points to 14%, Other Christian lost 11 points, ending at 35%. Other Religions went up 3 points to 9%. Most striking, Unaffiliated increased by 15 points to 40%, a level that shows how the "rise of the Nones" is accelerating among the youngest cohorts (see more on this in a section in the main summary "Introducing Generation Z:). Millennials (and Generation Z) demonstrate what is now called by some the "rise of the Done," with no lingering interest in spirituality, even a growing contempt for religion. Early on as Unaffiliateds began to increase, the dominant choice was Nothing in Particular. With Millennials, the 15-point increase since 2007 is spread evenly between Atheist (from 3% to 8%), Agnostic (from 4% to 9%), and Nothing in particular(from 18% to 24%).
Of all the demographic factors presented by Pew, age cohort should sound alarms for church leaders. We are well past the time when it could be assumed that a loss of interest in religion following college was not uprising and there would be a return to church (or some degree of adherence) with marriage and family. We are now well into the 21st century and all the familiar patterns have changed (age of marriage and family, cohabitation versus marriage, to name just two).
Figure 5 - Religious Affiliation Composition by Region (2007 vs 2018/19)
In terms of overall Christian affiliation (Catholic + Other Christian), all regions have declined 11 points or more (the Northeast 17 points) and the differences between regions has narrowed. In 2007, for example, the South was 12 points higher than the West in Christian affiliation (83% versus 71%). In the latest survey, that gap has dropped to 10 points (70% versus 60%), while the Northeast has dropped 17 points to 59%, one point below the West instead of 5 points higher as it was in 2007. The Midwest remains second strongest in Christian affiliation to the South (still within 3 points), but it has dropped 13 points from 80% to 67% and the 9 point gap between the Midwest and Northeast has been reduced to 7 points. Looking at regions by strength of Christian affiliation:
The South
Figure 6 - Religious Affiliation Composition by Education (2007 vs 2018/19)
Whether people have any college education is less of a factor in affiliation than one might expect (similar to Attendance at Religious Services).
Both those with and without college education dropped nearly the same from 2007: College educated were down 14 points, from 73% to 59%, No College down 13 points, from 81% to 68%. That increased the gap between them by only 1 point (8 points in 2007, 9 in the latest survey).
Catholic adherents declined in both groups 3-5 points. In 2007 the two groups were within 1 point, 23% for College and 24% for No College. In the latest survey, No College dropped three points to 21%, but those with College education dropped five points to 18%, increasing the spread between them slightly.
The spread for Other Christian narrowed slightly, from 7 points in 2007 to 5 in the latest survey. This is reflected in a larger drop for No College, at 10 points, from 57% to 47%, while those with College dropped 8 points, from 50% to 42%., both faking below the majority threshold.
Other Religions retained the same pattern as 2007, but both groups were up 2 points, with College (11%) double the rate for No College (5%).
Unaffiliated were nearly even in 2007, but College educated pulled ahead of No College by 4 points in the latest survey. While Nothing in particular increased for both groups (4 points for College, 5 points for No College), gains of 2 to 4 points for Atheist and Agnostic produced a more dramatic impact on the chart.
The overall trend seems to be a noticeable acceleration of College educated into Unaffiliated, but Christian (Catholic + Other Christian) still holds a majority.
Figure 6 - Religious Affiliation Composition by Political Preference (2007 vs 2018/19)
As it did for Attendance at Religious Services, Political Party Preference plays a major role in affiliation.
Those identifying as Republicans or Republican leaning claimed Christian (Catholic + Other Christian) affiliation in 2007, dropping 8 points to 79% in the latest survey. Democrats and those leaning Democratic were 13 points below Republicans in 2007, with 74% claiming Christian affiliation. That dropped by 19 points to 55% in the latest survey and increased the spread to 22 points.
The differences between Catholic and Other Christian are striking (as has been true for other demographics factors). Republicans claiming Catholic affiliation were only 2 points below Democrats in 2007 (22% to 24%). In the latest survey the spread narrowed to one point (19% to 20%), with a modest drop of 2 points for Republicans and 4 points for Democrats.
The overall decline for Other Christian of 10 points between surveys was lopsided, with Republics declining only 5 points and Democrats falling 14 points, from 50% to 36%. Republicans retained a majority position as Other Christian by a still-strong, but declining, margin, while Democrats went from sitting at the 50% majority threshold to 36%, 24 points lower than Republicans.
In this context, it should not be surprising that news reports broadly pointed out the overwhelming support of "evangelicals" for Donald Trump, pushing him to victory in 2016 and retaining loyalty in 2020. Because of the corruption of the term "evangelical," however, I strongly suggest the situation is more nuanced. At the same time, it cannot be denied that the numbers here clearly show a retreat by Democrats from Other Christian affiliation. I discuss in greater detail the problem of the misuse of the term evangelical in the main Summary.
By Political Preference, Other Religions maintained a similar pattern from 2007, increasing 2 points for both Republicans and Democrats.
Unaffiliated increased
10 points since 2007, with Republicans moving up 6 points from 10% to 16%, while Democrats more than doubled that, at 15 points, moving up from 19% to 34%. All of the Republican increase was in Nothing in particular, with Atheist and Agnostic remaining steady at 1% and 2% respectively. Democrats, however, saw a 5 point gain in Atheist, to 7%, a 4 point gain in Agnostic, to 7%, and a 7 point rise in Nothing in particular, to 20%.
Overall, Republicans and Democrats changed little from 2007 in their affiliation as Catholics or Other Religions. The major disparities are a reliably modest decline of Republicans as Other Christian contrasted with a much larger decline of Democrats claiming Other Christian—down to just over a third, nearly matching their rising identification as Unaffiliated. Despite that, those declaring a preference for either party and claiming Christian affiliation (Catholic and Other) still represent a majority, though Democrats are far closer to losing that distinction than are Republicans.
©2026 Stuart Johnson & Associates
Resouce Center | Contact Us
©2026 Stuart Johnson & Associates