
Making Information Make Sense
Religion in America
Digging Deeper: Religious Service Attendance
updated May 2021
< back to Religion in America summary
Summary
Pew Research Center has asked people about their attendance at religious services, from very frequent to none, along several demographic factors. Data are available on a nearly annual basis from 2007 through 2018/19.
In general, attendance has gone down by about 10-percent overall between the surveys of 2007 and 2018/19. A quick review provides a picture that shows frequent attenders (once a month or more) moving from majority to minority status in that time period. :
- Gender -Half of women respondents are frequent attenders, but that has dropped from a majority position of nearly six in ten in 2007. Men were about 10% below women in frequent attendance for both 2007 and 2018/19.
- Race - Black respondents remain the highest for frequent attendance, followed by Hispanic, then White, but all have dropped since 2007.
- Age Cohort - Silent Generation (born 1928-1945) are the most likely to attend frequently (six in ten), with virtually no change since 2007. Millennials (1980-1996) are the weakest, at about a third and also dropped the most since 2007.
- Geographic Region - Just over half of respondents in the South are frequent attenders, followed by the Midwest, West, and Northeast (37%). All were down around 10% since 2007.
- Education - Perhaps surprisingly, this is the factor with the least difference. 44% of respondents with college degrees and 45% of those without degrees reported frequent attendance, but that represents sliding from majority to minority position since 2007.
- Political Party Preference - A slight majority of respondents claiming Republican preference are frequent attenders (54%), while those identifying as Democrats were significantly lower, at just over a third (38%). As in other measures, both were down in overall attendance about 10% since 2007.
The Details
In the following charts, the columns represent the latest data from aggregated political studies for 2018/19. The colored bar represents the earliest data from the 2007 Religious Landscape Study (RLS). The RLS has been done in 2007 and 2014. Aggregated political survey results are available from 2009 through 2018/19. (See the detailed tables).
Figure 1 - Attendance by Gender
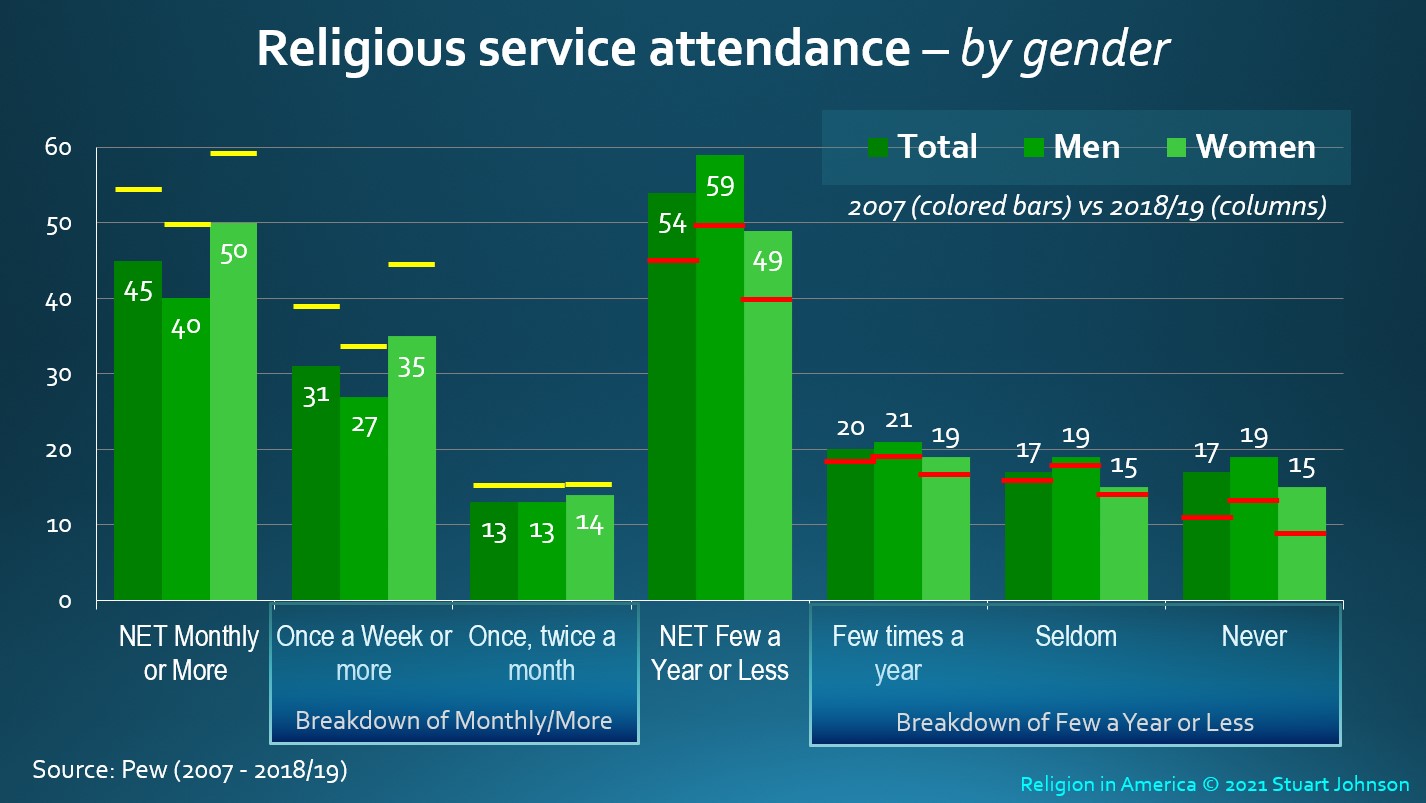
Women respondents moved from a majority of frequent attenders in 2007 (six in ten) to an even split in 2018/19. Men were ten points below for both years.
A similar pattern at the other extreme is seen among those with low or no attendance, with the most significant increase from 2007 among those who report never attending, while those reporting a few times a year or seldom showed far less change.
Loss of interest and commitment alone do not explain why the greatest changes are evident at the extremes (Once a Week going down, Never going up at about the same pace). More likely it is differences in age cohorts (Figure 3). The oldest cohort, which dominates Once a Week, is dying out and not reproducing more frequent attenders. Meanwhile, the youngest cohorts have distanced themselves from organized religion, swelling the ranks of those who Never attend. In between the extremes, there is far less change since 2007.
Figure 2 - Attendance by Race
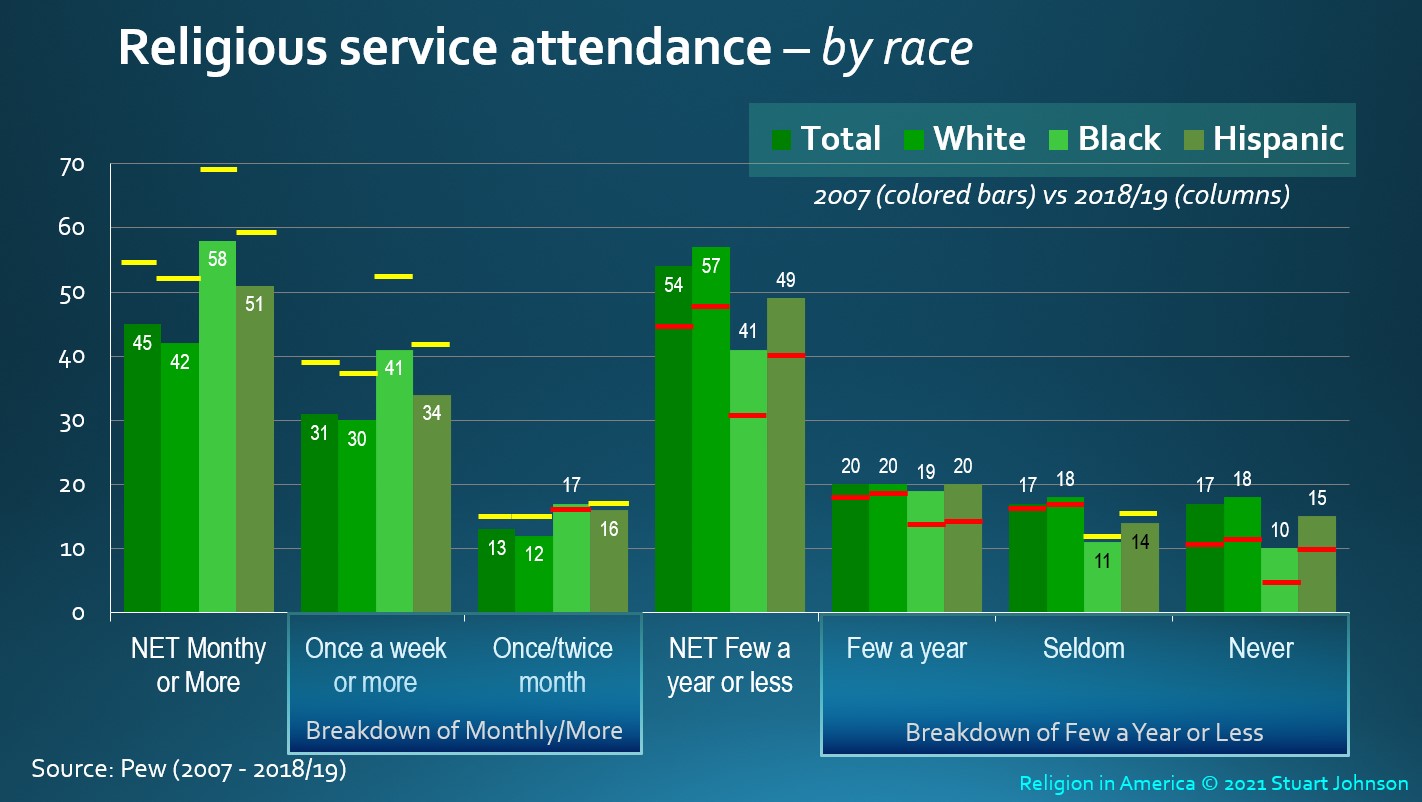
White, Black, and Hispanic respondents who were frequent attenders (Once a Month or More) were all in the majority in 2007. By 2018/19 they had each lost about 10 points. Black frequent attenders remained in the majority at 58%, but fell 11 points. Hispanics lost 8 points, barely holding on to a majority position at 51%, , White frequent attenders dropped 10 points, falling into the minority, at 45%.
Most of the decrease across categories is found in Once a Week or More. The difference for Once or Twice a Month shows much smaller decreases for Whites and Hispanics. Blacks went up one point in Once or Twice a Month over 2007.
Looking at the breakdown of Few a Year or Less, Whites saw the largest movement to Never. On the other hand, Blacks and Hispanics saw increases split between Few a Year and Never, with Seldom decreasing a point from 2007.
Figure 3 - Attendance by Age

Generation Z (born 1996-2015) is not included in this analysis because most were not yet adults during the 2018/19 survey.
Religious service attendance by age cohort is the most telling of all the factors dealt with here. Not only was the Silent cohort (born 1928-45) far above all others as frequent attenders, but they remained remarkably stable between the 2007 and 2018/19 surveys, dropping only 1 point to retain a strong majority of 61%. among their cohort. Frequent attenders dropped among the other groups: fully fifteen points to 35% among Millennials, 5 points each for Generation X and Baby Boomers.
This pattern explains better than any other demographic factor why losses among the most frequent attenders seem to translate into increases in Never, rather than spreading among the options in between. The strongest frequent attenders are also the oldest, and they are not reproducing. As they die, they are being replaced by an increasing proportion of younger individuals who turn the tables on the numbers: 61% of Silents are frequent attenders, 64% of Millennials do not attend (22%) or do so infrequently (42%).
Figure 4 - Attendance by Geographical Region

In 2007, frequent attenders were the majority in the Midwest and South. By 2018/19 each region lost frequent attenders and only the South held a majority, but barely, at 51%. The Northeast fell 11 points, to 37%, the lowest proportion of frequent attenders by region both years. The Midwest and South both lost 10 points, ending at 45% and 51% respectively. The West had the smallest change, dropping 8 points to 40%. The vast majority in all regions lost the most in once a week or more, with smaller losses for those attending once or twice a month.
The Northeast had the largest majority of few a year or less, at 61%, followed by the West at 59%, the Midwest at 53%, and the South at 47%, all increasing roughly 10 points since 2007. The South saw few a year increase by 3 points and Never by 8 points. The Northeast saw a shift of 3 points for Seldom and 6 points for Never. For the Midwest and West, the majority of change added to the Never column, with only one or two point changes in Few or Seldom.
Figure 5 - Attendance by Education
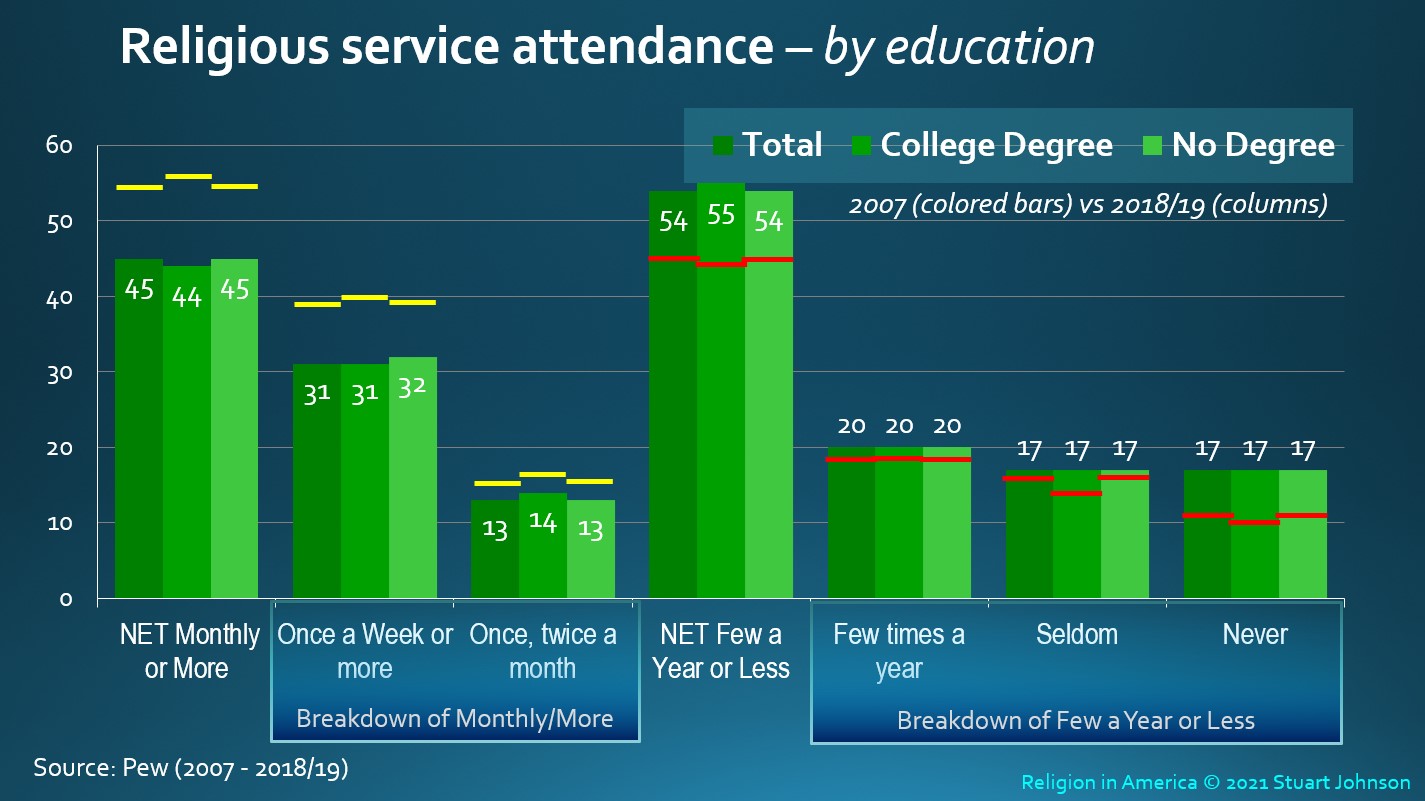
I will admit that I expected education to play a bigger role in religious service attendance. The overall pattern is similar to other factors, about a 10% loss in frequent attenders, with most of those coming from Once a Week or more, and the largest gain at the low end being among Never. Whether the respondent had a college degree or not made little difference. The main takeaway is that frequent attenders, irrespective of education level, lost the majority position held in 2007 and are now in the minority, with the balance shifting to infrequent or no attendance. .
Figure 6 - Attendance by Political Party Preference

Party preference shows significant differences between self-identified Republicans and Democrats. A majority of those claiming Republican preference still report frequent religious service attendance, though it is down from 64% to 54% between 2007 and 2018/19. Those attending Once a week or more dropped from 48% to 40%, not nearly as dramatic as that among Democrats but still shrinking. Those claiming Never rose modestly from 7% to 11%, again far less dramatic than Democrats.
For those claiming Democratic preference, they shifted from a near equal split in 2007 to a 22-point swing toward infrequent attendance, with the biggest increase in Never (rising from 12% to 21%) and Once or week or more dropping from 34% to 25%.
Religion in America
Digging Deeper: Religious Service Attendance
updated May 2021
< back to Religion in America summary
Summary
Pew Research Center has asked people about their attendance at religious services, from very frequent to none, along several demographic factors. Data are available on a nearly annual basis from 2007 through 2018/19.
In general, attendance has gone down by about 10-percent overall between the surveys of 2007 and 2018/19. A quick review provides a picture that shows frequent attenders (once a month or more) moving from majority to minority status in that time period. :
- Gender -Half of women respondents are frequent attenders, but that has dropped from a majority position of nearly six in ten in 2007. Men were about 10% below women in frequent attendance for both 2007 and 2018/19.
- Race - Black respondents remain the highest for frequent attendance, followed by Hispanic, then White, but all have dropped since 2007.
- Age Cohort - Silent Generation (born 1928-1945) are the most likely to attend frequently (six in ten), with virtually no change since 2007. Millennials (1980-1996) are the weakest, at about a third and also dropped the most since 2007.
- Geographic Region - Just over half of respondents in the South are frequent attenders, followed by the Midwest, West, and Northeast (37%). All were down around 10% since 2007.
- Education - Perhaps surprisingly, this is the factor with the least difference. 44% of respondents with college degrees and 45% of those without degrees reported frequent attendance, but that represents sliding from majority to minority position since 2007.
- Political Party Preference - A slight majority of respondents claiming Republican preference are frequent attenders (54%), while those identifying as Democrats were significantly lower, at just over a third (38%). As in other measures, both were down in overall attendance about 10% since 2007.
The Details
In the following charts, the columns represent the latest data from aggregated political studies for 2018/19. The colored bar represents the earliest data from the 2007 Religious Landscape Study (RLS). The RLS has been done in 2007 and 2014. Aggregated political survey results are available from 2009 through 2018/19. (See the detailed tables).
Figure 1 - Attendance by Gender
Women respondents moved from a majority of frequent attenders in 2007 (six in ten) to an even split in 2018/19. Men were ten points below for both years.
A similar pattern at the other extreme is seen among those with low or no attendance, with the most significant increase from 2007 among those who report never attending, while those reporting a few times a year or seldom showed far less change.
Loss of interest and commitment alone do not explain why the greatest changes are evident at the extremes (Once a Week going down, Never going up at about the same pace). More likely it is differences in age cohorts (Figure 3). The oldest cohort, which dominates Once a Week, is dying out and not reproducing more frequent attenders. Meanwhile, the youngest cohorts have distanced themselves from organized religion, swelling the ranks of those who Never attend. In between the extremes, there is far less change since 2007.
Figure 2 - Attendance by Race
White, Black, and Hispanic respondents who were frequent attenders (Once a Month or More) were all in the majority in 2007. By 2018/19 they had each lost about 10 points. Black frequent attenders remained in the majority at 58%, but fell 11 points. Hispanics lost 8 points, barely holding on to a majority position at 51%, , White frequent attenders dropped 10 points, falling into the minority, at 45%.
Most of the decrease across categories is found in Once a Week or More. The difference for Once or Twice a Month shows much smaller decreases for Whites and Hispanics. Blacks went up one point in Once or Twice a Month over 2007.
Looking at the breakdown of Few a Year or Less, Whites saw the largest movement to Never. On the other hand, Blacks and Hispanics saw increases split between Few a Year and Never, with Seldom decreasing a point from 2007.
Figure 3 - Attendance by Age
Generation Z (born 1996-2015) is not included in this analysis because most were not yet adults during the 2018/19 survey.
Religious service attendance by age cohort is the most telling of all the factors dealt with here. Not only was the Silent cohort (born 1928-45) far above all others as frequent attenders, but they remained remarkably stable between the 2007 and 2018/19 surveys, dropping only 1 point to retain a strong majority of 61%. among their cohort. Frequent attenders dropped among the other groups: fully fifteen points to 35% among Millennials, 5 points each for Generation X and Baby Boomers.
This pattern explains better than any other demographic factor why losses among the most frequent attenders seem to translate into increases in Never, rather than spreading among the options in between. The strongest frequent attenders are also the oldest, and they are not reproducing. As they die, they are being replaced by an increasing proportion of younger individuals who turn the tables on the numbers: 61% of Silents are frequent attenders, 64% of Millennials do not attend (22%) or do so infrequently (42%).
Figure 4 - Attendance by Geographical Region
In 2007, frequent attenders were the majority in the Midwest and South. By 2018/19 each region lost frequent attenders and only the South held a majority, but barely, at 51%. The Northeast fell 11 points, to 37%, the lowest proportion of frequent attenders by region both years. The Midwest and South both lost 10 points, ending at 45% and 51% respectively. The West had the smallest change, dropping 8 points to 40%. The vast majority in all regions lost the most in once a week or more, with smaller losses for those attending once or twice a month.
The Northeast had the largest majority of few a year or less, at 61%, followed by the West at 59%, the Midwest at 53%, and the South at 47%, all increasing roughly 10 points since 2007. The South saw few a year increase by 3 points and Never by 8 points. The Northeast saw a shift of 3 points for Seldom and 6 points for Never. For the Midwest and West, the majority of change added to the Never column, with only one or two point changes in Few or Seldom.
Figure 5 - Attendance by Education
I will admit that I expected education to play a bigger role in religious service attendance. The overall pattern is similar to other factors, about a 10% loss in frequent attenders, with most of those coming from Once a Week or more, and the largest gain at the low end being among Never. Whether the respondent had a college degree or not made little difference. The main takeaway is that frequent attenders, irrespective of education level, lost the majority position held in 2007 and are now in the minority, with the balance shifting to infrequent or no attendance. .
Figure 6 - Attendance by Political Party Preference
Party preference shows significant differences between self-identified Republicans and Democrats. A majority of those claiming Republican preference still report frequent religious service attendance, though it is down from 64% to 54% between 2007 and 2018/19. Those attending Once a week or more dropped from 48% to 40%, not nearly as dramatic as that among Democrats but still shrinking. Those claiming Never rose modestly from 7% to 11%, again far less dramatic than Democrats.
For those claiming Democratic preference, they shifted from a near equal split in 2007 to a 22-point swing toward infrequent attendance, with the biggest increase in Never (rising from 12% to 21%) and Once or week or more dropping from 34% to 25%.
©2026 Stuart Johnson & Associates
Resouce Center | Contact Us
©2026 Stuart Johnson & Associates