
Making Information Make Sense
InfoMatters
Category: Public Communication / Topics: Media • Opinion research • Perception
Polling the First GOP Debate
by Stu Johnson
 Building article list (this could take a few moments)...
Posted: August 223, 2015
Looking under the hood at the NBC/SurveyMonkey survey…
Debate scores big for Fox
The first debate of Republican presidential candidates on August 6 produced a record-breaking audience for Fox News—some 24-million people watched the two-hour prime-time debate with the top-10 candidates. Nearly 8-million were in the 25-54 age range, the most desired by news advertisers. About 6-million people watched the earlier debate among the six second-tier candidates. With so many options available, those are huge numbers. As the leading cable news channel, Fox averages about 2-million viewers. About 11-million stayed beyond the prime time debate for at least part of the post-debate analysis—about ten times the audience for that time slot. [1]
The NBC/SurveyMonkey Poll
Over the weekend came reports of an NBC poll conducted by SurveyMonkey that (pardon the pun) trumpeted the clear lead still held by Donald Trump, with 23%, essentially unchanged from polls conducted before the debate. Movement was noted for other candidates, however, with Ted Cruz moving up to 13% in the SurveyMonkey poll, Ben Carson at 11% and Carly Fiorina and Marco Rubio each with 8%. [2]
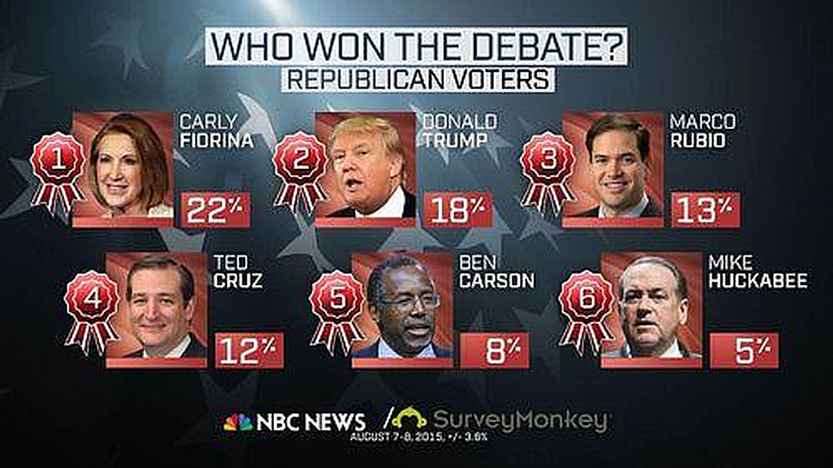
More significant in my opinion was the perception of winners in the two debates since some concern had been expressed about the potential for any influence in the first debate. 22% of survey respondents saw Carly Fiorina, who appeared in the "second tier" first debate, on top followed by Donald Trump at 18%, Marco Rubio at 13%, Ted Cruz at 12%, Ben Carson at 8% and Mike Huckabee by 5%.
Digging Deeper
As I pointed out in an earlier blog (“Driven by Polls”, April 8, 2015), it is always good to view overnight poll results with skepticism (in contrast to more extensive survey research like that conducted by Pew Research, The Gallup Organization and others).
The first thing to consider with analysis of the NBC poll is the size of the audience. While record-setting, the 24 million watching the prime-time debate represented less than 10% of the roughly 245-million adults in the United States. Therefore, the opinions expressed by many people came not from direct observation but from replays, clips from the debates, news reports and analysis, online sources and social media, hearsay, as well as a mixture of misinformation and ignorance. Yet, the survey has been cast as representing the nation...not just those who either watched or paid enough attention to express an informed opinion, which I would argue would be the appropriate perspective. Even so,most people are willing to state their opinion. Therefore, it is interesting to question how those opinions are formed and how much they mean in terms of future behavior (news coverage, the nominating process and the election).
According to the report on methodology, “The NBC News Online Survey was conducted online by SurveyMonkey August 7-8, 2015 among a national sample of 3,551 adults aged 18 and over. Respondents for this non-probability survey were selected from the nearly three million people who take surveys on the SurveyMonkey platform each day.” [3]
In my earlier blog I pointed out that the standard for survey research is the us of a random sample. This does not mean it is haphazard, but using techniques that ensure that every person in the target population (all adults, likely voters, etc.) has an equal statistical probability of being selected. SurveyMonkey justifies its results on the basis that they have built up a large base of potential respondents, so that they can come close to what a true random sample would have produced.
While the three million who participate in SurveyMonkey is a significant number for many situations, for a national political survey that pool of potential respondents represents only one percent of adults and a highly self-selected subset at that. And while the number of 3,551 responses is consistent with reasonable margins of error for national surveys, by their own admission it is not a statistically valid random sample, but a “non-probability” survey. It would be easy to accuse SurveyMonkey of being deceptive, cleverly using words to mask reality, though I think it is more important that you, as a consumer of information, know the basics.
I have participated in surveys conducted through SurveyMonkey and think that developing a sample from their participant pool can work well in specific situations. It is a valid way of conducting surveys among established constituencies where you provide the list of respondents (a company, members of a professional group, etc.). It could also be possible to use the known demographics of SurveyMonkey’s pool of available respondents to conduct focused research. My concern has to do with trying to replicate a valid national random sample using a “non-probability” approach.
Many surveys have to weight the results to take into account differences between the survey and target populations. The NBC/SurveyMonkey methodology statement shows raw numbers and the margin of error for each demographic category—without showing the weight required. Here is the NBC/SurveyMonkey table, with additional columns to show the variance from the population.
NBC/SurveyMonkey |
Comparison to Population |
||||
|
Group |
Unweighted N |
Plus or Minus |
SurveyMonkey |
Population |
Difference |
|
Total sample |
3,551 |
2.4 % |
|
|
|
|
|
|
|
|
|
|
|
Republican |
1,591 |
3.4% |
44.8% |
23% |
|
|
Democrat |
1,402 |
3.6% |
39.5% |
28% |
|
|
Independent |
Not included |
|
46% |
|
|
|
|
|
|
|
|
|
|
18-29 |
575 |
6.8% |
16.2% |
22.0% |
- 5.8% |
|
30-44 |
711 |
5.0% |
20.0% |
26.0% |
- 6.0% |
|
45-64 |
1,631 |
3.4% |
45.9% |
34.8% |
+11.1% |
|
65+ |
634 |
4.6% |
17.9% |
17.2% |
+0.7% |
|
|
|
|
|
|
|
|
White |
2,880 |
2.5% |
81.1% |
63.1% |
+18.0% |
|
Black |
203 |
8.4% |
5.7% |
13.6% |
- 7.9% |
|
Hispanic |
181 |
9.2% |
5.1% |
16.3% |
--11.2% |
|
Other |
287 |
7.7% |
8.1% |
7.0% |
+1.1% |
Comparison Population sources: Political identification from Gallup 2015, demographics from US Census Bureau (2010 decennial census – last year for national results) [4]
Why does the party affiliation appear so much different from the numbers from Gallup (which are within a percentage point of those from Pew)? When asked specifically, the SurveyMonkey respondents were 30% Republican, 32% Democrat and 36% Independent—a little more Republican than Gallup and Pew found, but the topic of the survey was a Republican debate. SurveyMonkey then asked Independents if they “leaned” toward one party or the other. That is how the party breakdown in the chart was determined. This is similar to the approach taken by Gallup and Pew in surveys that include “leaning.” Gallup reported Democrat/Democrat-leaning at 46% and Republican/Republican-leaning at 41% in the second quarter of 2015.
Notice that the margin of error does not reflect how much weight has been applied to the raw numbers to bring the sample in line with the actual population. Rather, it simply reflects the rising margin of error as the subset (“group”) gets smaller. In reality, the weighting would have had to account for an overrepresentation by 10% or more of people 45-64 and whites, and an underrepresentation by 5% or more of people 18-44, blacks and Hispanics.
Even more telling is the survey’s own analysis of respondent exposure to the debates.
18% watched both debates
2% watched the first debate
21% watched the second debate
33% did not watch the debates live, but followed coverage of them in the news
25% did not watch the debates and haven’t really followed news coverage about them
2% provided no answer (Due to rounding errors, the total exceeds 100%)
The four in ten (41%) who watched one or both debates represents about four times the proportion of adults who actually watched the debates according to the ratings. (At this rate, the TV audience would have been just over 100-million). In addition, another third said they did not watch live, but followed the coverage—meaning that fully three-quarters of respondents either watched or were somewhat informed about the debates. That is fine, but should have been more clearly represented, rather than allowing the impression that this was a national random sample (particularly as the results spread beyond NBC).
Once again, as I urged in my earlier blog, take care when assessing surveys. Don’t take the numbers at face value without understanding more about the survey itself—the sample, the questions, and how the results are presented. We’re still many months away from the nominating conventions, which means the polling is just getting warmed up!
NOTES:
- Among the reports on the Nielsen ratings for the debates see:
money.cnn.com/2015/08/07/media/gop-debate-fox-news-ratings/
variety.com/2015/tv/news/ratings-fox-news-republican-debate-1201559312/
and Fox’s own report at insider.foxnews.com/2015/08/07/nielsen-fox-news-gop-debate-was-highest-rated-primary-debate-history-24-million-viewers - NBC news story on the poll - www.nbcnews.com/meet-the-press/new-nbc-news-survey-monkey-poll-donald-trump-still-lead-n406766
- NBC/SurveyMonkey results and methodology - www.pdf.investintech.com/preview/33f7458c-3ec9-11e5-9555-002590d31986/index.html
- For party identification trends including Independents, see:
www.gallup.com/poll/15370/party-affiliation.aspx (Gallup)
www.people-press.org/interactives/party-id-trend/ (Pew Research Center)
For the Gallup survey showing two-party preference, with “leaners” see:
www.gallup.com/poll/183887/democrats-regain-edge-party-affiliation.aspx
Search all articles by Stu Johnson
Building article list (this could take a few moments) ...Stu Johnson is owner of Stuart Johnson & Associates, a communications consultancy in Wheaton, Illinois focused on "making information make sense."
• E-mail the author (moc.setaicossajs@uts*)* For web-based email, you may need to copy and paste the address yourself.
Posted: August 223, 2015 Accessed 2,795 times
![]() Go to the list of most recent InfoMatters Blogs
Go to the list of most recent InfoMatters Blogs
![]() Search InfoMatters (You can expand the search to the entire site)
Search InfoMatters (You can expand the search to the entire site)
Loading requested view (this could take a few moments)...There are two ways to live: you can live as if nothing is a miracle; you can live as if everything is a miracle.

InfoMatters
Category: Public Communication / Topics: Media • Opinion research • Perception
Polling the First GOP Debate
by Stu Johnson
Building article list (this could take a few moments)...Posted: August 223, 2015
Looking under the hood at the NBC/SurveyMonkey survey…
Debate scores big for Fox
The first debate of Republican presidential candidates on August 6 produced a record-breaking audience for Fox News—some 24-million people watched the two-hour prime-time debate with the top-10 candidates. Nearly 8-million were in the 25-54 age range, the most desired by news advertisers. About 6-million people watched the earlier debate among the six second-tier candidates. With so many options available, those are huge numbers. As the leading cable news channel, Fox averages about 2-million viewers. About 11-million stayed beyond the prime time debate for at least part of the post-debate analysis—about ten times the audience for that time slot. [1]
The NBC/SurveyMonkey Poll
Over the weekend came reports of an NBC poll conducted by SurveyMonkey that (pardon the pun) trumpeted the clear lead still held by Donald Trump, with 23%, essentially unchanged from polls conducted before the debate. Movement was noted for other candidates, however, with Ted Cruz moving up to 13% in the SurveyMonkey poll, Ben Carson at 11% and Carly Fiorina and Marco Rubio each with 8%. [2]
More significant in my opinion was the perception of winners in the two debates since some concern had been expressed about the potential for any influence in the first debate. 22% of survey respondents saw Carly Fiorina, who appeared in the "second tier" first debate, on top followed by Donald Trump at 18%, Marco Rubio at 13%, Ted Cruz at 12%, Ben Carson at 8% and Mike Huckabee by 5%.
Digging Deeper
As I pointed out in an earlier blog (“Driven by Polls”, April 8, 2015), it is always good to view overnight poll results with skepticism (in contrast to more extensive survey research like that conducted by Pew Research, The Gallup Organization and others).
The first thing to consider with analysis of the NBC poll is the size of the audience. While record-setting, the 24 million watching the prime-time debate represented less than 10% of the roughly 245-million adults in the United States. Therefore, the opinions expressed by many people came not from direct observation but from replays, clips from the debates, news reports and analysis, online sources and social media, hearsay, as well as a mixture of misinformation and ignorance. Yet, the survey has been cast as representing the nation...not just those who either watched or paid enough attention to express an informed opinion, which I would argue would be the appropriate perspective. Even so,most people are willing to state their opinion. Therefore, it is interesting to question how those opinions are formed and how much they mean in terms of future behavior (news coverage, the nominating process and the election).
According to the report on methodology, “The NBC News Online Survey was conducted online by SurveyMonkey August 7-8, 2015 among a national sample of 3,551 adults aged 18 and over. Respondents for this non-probability survey were selected from the nearly three million people who take surveys on the SurveyMonkey platform each day.” [3]
In my earlier blog I pointed out that the standard for survey research is the us of a random sample. This does not mean it is haphazard, but using techniques that ensure that every person in the target population (all adults, likely voters, etc.) has an equal statistical probability of being selected. SurveyMonkey justifies its results on the basis that they have built up a large base of potential respondents, so that they can come close to what a true random sample would have produced.
While the three million who participate in SurveyMonkey is a significant number for many situations, for a national political survey that pool of potential respondents represents only one percent of adults and a highly self-selected subset at that. And while the number of 3,551 responses is consistent with reasonable margins of error for national surveys, by their own admission it is not a statistically valid random sample, but a “non-probability” survey. It would be easy to accuse SurveyMonkey of being deceptive, cleverly using words to mask reality, though I think it is more important that you, as a consumer of information, know the basics.
I have participated in surveys conducted through SurveyMonkey and think that developing a sample from their participant pool can work well in specific situations. It is a valid way of conducting surveys among established constituencies where you provide the list of respondents (a company, members of a professional group, etc.). It could also be possible to use the known demographics of SurveyMonkey’s pool of available respondents to conduct focused research. My concern has to do with trying to replicate a valid national random sample using a “non-probability” approach.
Many surveys have to weight the results to take into account differences between the survey and target populations. The NBC/SurveyMonkey methodology statement shows raw numbers and the margin of error for each demographic category—without showing the weight required. Here is the NBC/SurveyMonkey table, with additional columns to show the variance from the population.
NBC/SurveyMonkey |
Comparison to Population |
||||
|
Group |
Unweighted N |
Plus or Minus |
SurveyMonkey |
Population |
Difference |
|
Total sample |
3,551 |
2.4 % |
|
|
|
|
|
|
|
|
|
|
|
Republican |
1,591 |
3.4% |
44.8% |
23% |
|
|
Democrat |
1,402 |
3.6% |
39.5% |
28% |
|
|
Independent |
Not included |
|
46% |
|
|
|
|
|
|
|
|
|
|
18-29 |
575 |
6.8% |
16.2% |
22.0% |
- 5.8% |
|
30-44 |
711 |
5.0% |
20.0% |
26.0% |
- 6.0% |
|
45-64 |
1,631 |
3.4% |
45.9% |
34.8% |
+11.1% |
|
65+ |
634 |
4.6% |
17.9% |
17.2% |
+0.7% |
|
|
|
|
|
|
|
|
White |
2,880 |
2.5% |
81.1% |
63.1% |
+18.0% |
|
Black |
203 |
8.4% |
5.7% |
13.6% |
- 7.9% |
|
Hispanic |
181 |
9.2% |
5.1% |
16.3% |
--11.2% |
|
Other |
287 |
7.7% |
8.1% |
7.0% |
+1.1% |
Comparison Population sources: Political identification from Gallup 2015, demographics from US Census Bureau (2010 decennial census – last year for national results) [4]
Why does the party affiliation appear so much different from the numbers from Gallup (which are within a percentage point of those from Pew)? When asked specifically, the SurveyMonkey respondents were 30% Republican, 32% Democrat and 36% Independent—a little more Republican than Gallup and Pew found, but the topic of the survey was a Republican debate. SurveyMonkey then asked Independents if they “leaned” toward one party or the other. That is how the party breakdown in the chart was determined. This is similar to the approach taken by Gallup and Pew in surveys that include “leaning.” Gallup reported Democrat/Democrat-leaning at 46% and Republican/Republican-leaning at 41% in the second quarter of 2015.
Notice that the margin of error does not reflect how much weight has been applied to the raw numbers to bring the sample in line with the actual population. Rather, it simply reflects the rising margin of error as the subset (“group”) gets smaller. In reality, the weighting would have had to account for an overrepresentation by 10% or more of people 45-64 and whites, and an underrepresentation by 5% or more of people 18-44, blacks and Hispanics.
Even more telling is the survey’s own analysis of respondent exposure to the debates.
18% watched both debates
2% watched the first debate
21% watched the second debate
33% did not watch the debates live, but followed coverage of them in the news
25% did not watch the debates and haven’t really followed news coverage about them
2% provided no answer (Due to rounding errors, the total exceeds 100%)
The four in ten (41%) who watched one or both debates represents about four times the proportion of adults who actually watched the debates according to the ratings. (At this rate, the TV audience would have been just over 100-million). In addition, another third said they did not watch live, but followed the coverage—meaning that fully three-quarters of respondents either watched or were somewhat informed about the debates. That is fine, but should have been more clearly represented, rather than allowing the impression that this was a national random sample (particularly as the results spread beyond NBC).
Once again, as I urged in my earlier blog, take care when assessing surveys. Don’t take the numbers at face value without understanding more about the survey itself—the sample, the questions, and how the results are presented. We’re still many months away from the nominating conventions, which means the polling is just getting warmed up!
NOTES:
- Among the reports on the Nielsen ratings for the debates see:
money.cnn.com/2015/08/07/media/gop-debate-fox-news-ratings/
variety.com/2015/tv/news/ratings-fox-news-republican-debate-1201559312/
and Fox’s own report at insider.foxnews.com/2015/08/07/nielsen-fox-news-gop-debate-was-highest-rated-primary-debate-history-24-million-viewers - NBC news story on the poll - www.nbcnews.com/meet-the-press/new-nbc-news-survey-monkey-poll-donald-trump-still-lead-n406766
- NBC/SurveyMonkey results and methodology - www.pdf.investintech.com/preview/33f7458c-3ec9-11e5-9555-002590d31986/index.html
- For party identification trends including Independents, see:
www.gallup.com/poll/15370/party-affiliation.aspx (Gallup)
www.people-press.org/interactives/party-id-trend/ (Pew Research Center)
For the Gallup survey showing two-party preference, with “leaners” see:
www.gallup.com/poll/183887/democrats-regain-edge-party-affiliation.aspx
Search all articles by Stu Johnson
Building article list (this could take a few moments) ...Stu Johnson is owner of Stuart Johnson & Associates, a communications consultancy in Wheaton, Illinois focused on "making information make sense."
• E-mail the author (moc.setaicossajs@uts*)* For web-based email, you may need to copy and paste the address yourself.
Posted: August 223, 2015 Accessed 2,796 times
![]() Go to the list of most recent InfoMatters Blogs
Go to the list of most recent InfoMatters Blogs
![]() Search InfoMatters (You can expand the search to the entire site)
Search InfoMatters (You can expand the search to the entire site)
Loading requested view (this could take a few moments)...InfoMatters
Category: Public Communication / Topics: Media • Opinion research • Perception
Polling the First GOP Debate
by Stu Johnson
Building article list (this could take a few moments)...Posted: August 223, 2015
Looking under the hood at the NBC/SurveyMonkey survey…
Debate scores big for Fox
The first debate of Republican presidential candidates on August 6 produced a record-breaking audience for Fox News—some 24-million people watched the two-hour prime-time debate with the top-10 candidates. Nearly 8-million were in the 25-54 age range, the most desired by news advertisers. About 6-million people watched the earlier debate among the six second-tier candidates. With so many options available, those are huge numbers. As the leading cable news channel, Fox averages about 2-million viewers. About 11-million stayed beyond the prime time debate for at least part of the post-debate analysis—about ten times the audience for that time slot. [1]
The NBC/SurveyMonkey Poll
Over the weekend came reports of an NBC poll conducted by SurveyMonkey that (pardon the pun) trumpeted the clear lead still held by Donald Trump, with 23%, essentially unchanged from polls conducted before the debate. Movement was noted for other candidates, however, with Ted Cruz moving up to 13% in the SurveyMonkey poll, Ben Carson at 11% and Carly Fiorina and Marco Rubio each with 8%. [2]
More significant in my opinion was the perception of winners in the two debates since some concern had been expressed about the potential for any influence in the first debate. 22% of survey respondents saw Carly Fiorina, who appeared in the "second tier" first debate, on top followed by Donald Trump at 18%, Marco Rubio at 13%, Ted Cruz at 12%, Ben Carson at 8% and Mike Huckabee by 5%.
Digging Deeper
As I pointed out in an earlier blog (“Driven by Polls”, April 8, 2015), it is always good to view overnight poll results with skepticism (in contrast to more extensive survey research like that conducted by Pew Research, The Gallup Organization and others).
The first thing to consider with analysis of the NBC poll is the size of the audience. While record-setting, the 24 million watching the prime-time debate represented less than 10% of the roughly 245-million adults in the United States. Therefore, the opinions expressed by many people came not from direct observation but from replays, clips from the debates, news reports and analysis, online sources and social media, hearsay, as well as a mixture of misinformation and ignorance. Yet, the survey has been cast as representing the nation...not just those who either watched or paid enough attention to express an informed opinion, which I would argue would be the appropriate perspective. Even so,most people are willing to state their opinion. Therefore, it is interesting to question how those opinions are formed and how much they mean in terms of future behavior (news coverage, the nominating process and the election).
According to the report on methodology, “The NBC News Online Survey was conducted online by SurveyMonkey August 7-8, 2015 among a national sample of 3,551 adults aged 18 and over. Respondents for this non-probability survey were selected from the nearly three million people who take surveys on the SurveyMonkey platform each day.” [3]
In my earlier blog I pointed out that the standard for survey research is the us of a random sample. This does not mean it is haphazard, but using techniques that ensure that every person in the target population (all adults, likely voters, etc.) has an equal statistical probability of being selected. SurveyMonkey justifies its results on the basis that they have built up a large base of potential respondents, so that they can come close to what a true random sample would have produced.
While the three million who participate in SurveyMonkey is a significant number for many situations, for a national political survey that pool of potential respondents represents only one percent of adults and a highly self-selected subset at that. And while the number of 3,551 responses is consistent with reasonable margins of error for national surveys, by their own admission it is not a statistically valid random sample, but a “non-probability” survey. It would be easy to accuse SurveyMonkey of being deceptive, cleverly using words to mask reality, though I think it is more important that you, as a consumer of information, know the basics.
I have participated in surveys conducted through SurveyMonkey and think that developing a sample from their participant pool can work well in specific situations. It is a valid way of conducting surveys among established constituencies where you provide the list of respondents (a company, members of a professional group, etc.). It could also be possible to use the known demographics of SurveyMonkey’s pool of available respondents to conduct focused research. My concern has to do with trying to replicate a valid national random sample using a “non-probability” approach.
Many surveys have to weight the results to take into account differences between the survey and target populations. The NBC/SurveyMonkey methodology statement shows raw numbers and the margin of error for each demographic category—without showing the weight required. Here is the NBC/SurveyMonkey table, with additional columns to show the variance from the population.
NBC/SurveyMonkey |
Comparison to Population |
||||
|
Group |
Unweighted N |
Plus or Minus |
SurveyMonkey |
Population |
Difference |
|
Total sample |
3,551 |
2.4 % |
|
|
|
|
|
|
|
|
|
|
|
Republican |
1,591 |
3.4% |
44.8% |
23% |
|
|
Democrat |
1,402 |
3.6% |
39.5% |
28% |
|
|
Independent |
Not included |
|
46% |
|
|
|
|
|
|
|
|
|
|
18-29 |
575 |
6.8% |
16.2% |
22.0% |
- 5.8% |
|
30-44 |
711 |
5.0% |
20.0% |
26.0% |
- 6.0% |
|
45-64 |
1,631 |
3.4% |
45.9% |
34.8% |
+11.1% |
|
65+ |
634 |
4.6% |
17.9% |
17.2% |
+0.7% |
|
|
|
|
|
|
|
|
White |
2,880 |
2.5% |
81.1% |
63.1% |
+18.0% |
|
Black |
203 |
8.4% |
5.7% |
13.6% |
- 7.9% |
|
Hispanic |
181 |
9.2% |
5.1% |
16.3% |
--11.2% |
|
Other |
287 |
7.7% |
8.1% |
7.0% |
+1.1% |
Comparison Population sources: Political identification from Gallup 2015, demographics from US Census Bureau (2010 decennial census – last year for national results) [4]
Why does the party affiliation appear so much different from the numbers from Gallup (which are within a percentage point of those from Pew)? When asked specifically, the SurveyMonkey respondents were 30% Republican, 32% Democrat and 36% Independent—a little more Republican than Gallup and Pew found, but the topic of the survey was a Republican debate. SurveyMonkey then asked Independents if they “leaned” toward one party or the other. That is how the party breakdown in the chart was determined. This is similar to the approach taken by Gallup and Pew in surveys that include “leaning.” Gallup reported Democrat/Democrat-leaning at 46% and Republican/Republican-leaning at 41% in the second quarter of 2015.
Notice that the margin of error does not reflect how much weight has been applied to the raw numbers to bring the sample in line with the actual population. Rather, it simply reflects the rising margin of error as the subset (“group”) gets smaller. In reality, the weighting would have had to account for an overrepresentation by 10% or more of people 45-64 and whites, and an underrepresentation by 5% or more of people 18-44, blacks and Hispanics.
Even more telling is the survey’s own analysis of respondent exposure to the debates.
18% watched both debates
2% watched the first debate
21% watched the second debate
33% did not watch the debates live, but followed coverage of them in the news
25% did not watch the debates and haven’t really followed news coverage about them
2% provided no answer (Due to rounding errors, the total exceeds 100%)
The four in ten (41%) who watched one or both debates represents about four times the proportion of adults who actually watched the debates according to the ratings. (At this rate, the TV audience would have been just over 100-million). In addition, another third said they did not watch live, but followed the coverage—meaning that fully three-quarters of respondents either watched or were somewhat informed about the debates. That is fine, but should have been more clearly represented, rather than allowing the impression that this was a national random sample (particularly as the results spread beyond NBC).
Once again, as I urged in my earlier blog, take care when assessing surveys. Don’t take the numbers at face value without understanding more about the survey itself—the sample, the questions, and how the results are presented. We’re still many months away from the nominating conventions, which means the polling is just getting warmed up!
NOTES:
- Among the reports on the Nielsen ratings for the debates see:
money.cnn.com/2015/08/07/media/gop-debate-fox-news-ratings/
variety.com/2015/tv/news/ratings-fox-news-republican-debate-1201559312/
and Fox’s own report at insider.foxnews.com/2015/08/07/nielsen-fox-news-gop-debate-was-highest-rated-primary-debate-history-24-million-viewers - NBC news story on the poll - www.nbcnews.com/meet-the-press/new-nbc-news-survey-monkey-poll-donald-trump-still-lead-n406766
- NBC/SurveyMonkey results and methodology - www.pdf.investintech.com/preview/33f7458c-3ec9-11e5-9555-002590d31986/index.html
- For party identification trends including Independents, see:
www.gallup.com/poll/15370/party-affiliation.aspx (Gallup)
www.people-press.org/interactives/party-id-trend/ (Pew Research Center)
For the Gallup survey showing two-party preference, with “leaners” see:
www.gallup.com/poll/183887/democrats-regain-edge-party-affiliation.aspx
Search all articles by Stu Johnson
Building article list (this could take a few moments) ...Stu Johnson is owner of Stuart Johnson & Associates, a communications consultancy in Wheaton, Illinois focused on "making information make sense."
• E-mail the author (moc.setaicossajs@uts*)* For web-based email, you may need to copy and paste the address yourself.
Posted: August 223, 2015 Accessed 2,797 times
![]() Go to the list of most recent InfoMatters Blogs
Go to the list of most recent InfoMatters Blogs
![]() Search InfoMatters (You can expand the search to the entire site)
Search InfoMatters (You can expand the search to the entire site)
Loading requested view (this could take a few moments)...