
Making Information Make Sense
InfoMatters
Category: Research / Topics: Demographics • Social Movements • Statistics • Trends
The Changing Family
Reported by Stu Johnson
 Building article list (this could take a few moments)...
Posted: November 334, 2017
A profile from the U.S. Census Bureau
I recently received two reports from the U.S. Census Bureau that reveal changes in the shape of the American family, some of them quite striking. I have added brief summaries in bold at the beginning of each section. The details are from the Census Bureau report.
The first report, dated November 16 was headlined “Over One-Quarter of Children Under Age 18 Live with One Parent”
CHILDREN LIVING WITH ONE PARENT
More than one-quarter of children under 18 live with one parent
A slight rise in the number living with the father
Most common status for mother is never married, for father divorced
The percentage of children living with one parent who live with just their father saw an increase from 12.5 percent in 2007 to 16.1 percent in 2017. That’s according to new statistics from the U.S. Census Bureau’s 2017 America’s Families and Living Arrangements table package.
“A higher percentage of children living with one parent live with their fathers than a decade ago,” said Rose Kreider, a demographer in the Fertility and Family Statistics Branch at the Census Bureau. “However, the majority of children living with one parent still live with their mothers.”
In 2017, 83.9 percent of children living with one parent live with their mothers, compared to 86.0 percent in 2012 and 87.5 percent in 2007.
Overall, nearly 20 million children under age 18 live with one parent, composing 27.1 percent of all living arrangements for children under age 18. In 2007, 25.8 percent of children under age 18 lived with one parent, and in 2012, one of the highest intervening years, 28.3 percent of children under age 18 lived with one parent.
Of children who live with one parent, the most common marital status of the mother is never married (49 percent). The most common marital status of the father is divorced (43 percent). For children who live with their mother only, the largest proportions are ages 6 to 11 (36 percent), and ages 12 to 17 (35 percent). For children who live with their father only, the largest proportions are ages 12 to 17 (43 percent), followed by the proportion ages 6 to 11 (31 percent).
“The age distribution of children under age 18 who live with one parent shows a higher proportion of children living with their mother only are younger than children living with their father only,” Kreider said.
There continues to be racial and ethnic variation in living arrangements for children under age 18. Today, over half (52.8 percent) of black alone children live with one parent, compared to 29.1 percent of Hispanic children and 22.4 percent of white alone children.
Other highlights:
HOUSEHOLDS
Getting smaller, fewer with five or more people, more with only one person
White householders down 10-percent since 1970
- White householders make up 79 percent of all households in the United States, down from 89 percent in 1970. Black and Hispanic householders each make up 13 percent of households, while Asian householders comprise 5 percent. (Hispanics may be any race so percentages will not add to 100.)
- Households have grown smaller over time, reflecting the decrease in family size and the rise of living alone. The average number of people living in each household has declined from 3.7 people in 1940 to 2.5 today.
- In 2017, there are 35.3 million single-person households, composing 28 percent of all households. In 1960, single-person households represented only 13 percent of all households.
- Today less than 1 in 10 households (9 percent) have five or more people living in them – a decrease from 23 percent of households in 1960.
MARRIAGE & FAMILY
Median age for first marriage approaching 30, up significantly since 1947
One in three men and three in ten women have never been married
Married couple households have dropped from 93- to 69-percent since 1950
- In 2017, the median age when adults first marry is 29.5 for men and 27.4 for women, up from ages 23.7 and 20.5, respectively, in 1947. In 2017, less than one-third of all adults (32 percent) have never been married, up from 23 percent in 1950.
- More men (35 percent) than women (29 percent) have never been married in 2017 compared to 26 percent of men and 20 percent of women in 1950.
- Married couples make up 69 percent of all families with children under age 18, compared to 93 percent in 1950.
- In 19 percent of married-couple households, neither the husband nor wife is in the labor force. Among married-couple households with neither spouse in the labor force, 75 percent are age 65 and older.
- Over a quarter (26 percent) of children under the age of 15 who live in married-couple families have a stay at home mother, compared to only 1 percent who have a stay at home father.
LIVING ARRANGEMENTS OF ADULTS & CHILDREN
More than half of young adults (18-24) live in the parental home
Nearly 5-million parents living with children under 18 are unmarried cohabitating
- Over half (55 percent) of young adults ages 18 to 24 live in the parental home, compared to 16 percent of young adults ages 25 to 34.
- Of the 64 million parents living with children under the age of 18, 4.9 million (8 percent) are unmarried cohabiting parents.
- Most adults between the ages of 65 to 74 still live with a spouse. For men in this age group, 72 percent live with a spouse, while for women the percentage is 56 percent. For adults age 75 and older, however, the percentage of those living with a spouse drops to 66 percent for men and just 33 percent for women.
UNMARRIED COUPLES
There are nearly 8 million unmarried opposite-sex couples living together
Of those, more than one-third live with children under the age of 18
- In 2017, there are 7.8 million unmarried opposite-sex couples living together.
- Of the unmarried opposite-sex couples living together, 37 percent live with children under the age of 18.
- Statistics about same-sex couples are available from the American Community Survey.
These statistics come from the 2017 Current Population Survey Annual Social and Economic Supplement, which has collected statistics on families for more than 60 years. The data shows characteristics of households, living arrangements, married and unmarried couples, and children.
For more information, see Families and Living Arrangements or visit census.gov.
CHILDREN LIVING WITH A PARENT WHO WORKS NONSTANDARD HOURS
More than four in ten children affected
A second related report, called “Parents Burning the Midnight Oil” appeared in my inbox November 21. The report was written by Brian Knop of the Fertility and Family Statistics division of the Census Bureau. The detailed tables and charts in Brian’s blog have not been included here. As he states, the blog does not address the circumstances that lead to parents working nonstandard schedules, but does show the magnitude of the situation. (Emphasis in text added).
Of the 72.3 million children in the United States living with at least one of their parents, 43 percent (31.0 million) live with a parent who is working a nonstandard schedule. Any schedule that does not reflect the traditional Monday through Friday daytime schedule is considered nonstandard. Parents with more than one job are considered nonstandard workers if any of the jobs have nonstandard schedules, such as evenings/nights, irregular or weekend hours.
However, in today’s 24/7 economy, many jobs exist outside the traditional daytime, Monday-Friday work schedule. It is common for a child to live with a parent who works at least some shifts in the late (or early) parts of the day or during the weekend. For example, there are 5.5 million children living with their mother only who works a nonstandard schedule. This accounts for 30 percent of all children living with their mother only.
Both mothers and fathers, and parents with or without another parent in the home engage in nonstandard work schedules – see the Survey of Income and Program Participation (SIPP). This survey is the premier source of information for income and program participation. SIPP collects data and measures change for many topics including, economic well-being, family dynamics, education, assets, health insurance, childcare and food security. This survey includes detailed questions about family living arrangements and employment.
Of the 3.3 million children living with only their father, 37 percent have a dad who works a nonstandard schedule. The percentage with a father who works a nonstandard schedule increases to 49 percent when we consider only those children whose father is employed. This is similar to the corresponding percentage for children living only with an employed mother who is working a nonstandard schedule (47 percent). Among the 48.4 million children living with two parents, 50 percent have at least one parent working a nonstandard schedule. When restricted to children living with two working parents, 61 percent have at least one parent who works a nonstandard schedule.
A higher share of children in two-parent families have a father with a nonstandard schedule (38 percent) than a mother with a nonstandard schedule (22 percent). If we look within this group of children and focus on those with two working parents in the home, 37 percent have a mother working a nonstandard schedule and 43 percent have a father working a nonstandard schedule. Of course, these may overlap so that some children live with parents who both work nonstandard schedules. What percentage of children living with two employed parents have only mom or only dad working a nonstandard schedule? While 18 percent of children living with two working parents have both parents working nonstandard schedules, it is more common that only the father works a nonstandard schedule — 24 percent. About 18 percent of children living with two working parents have only a mother who works a nonstandard schedule.
It is important to note that this blog does not address the circumstances that lead parents to work nonstandard schedules. However, SIPP data do allow us to see that many children live with a parent who works a nonstandard schedule.
To learn more about SIPP and the statistical guidelines used in producing this blog, visit the SIPP page, the SIPP 2014 source and accuracy document and the nonresponse bias report.
The estimates presented in this blog are subject to sampling and nonsampling error. For more information, visit the SIPP sampling page.
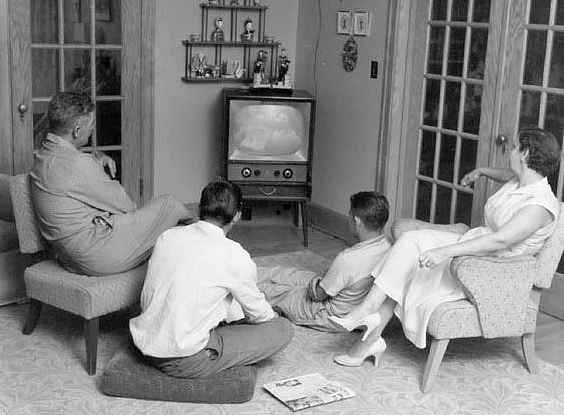
The definition and shape of family in America is not static. There have been dramatic changes, especially in the decades since the stereotypical families of suburban America flickered on the television screens of the 1950s, a new medium that itself would have profound effects on the family.
This blog was also posted as an article on SeniorLifestyle.org.
Posted: November 334, 2017 Accessed 5,387 times
![]() Go to the list of most recent InfoMatters Blogs
Go to the list of most recent InfoMatters Blogs
![]() Search InfoMatters (You can expand the search to the entire site)
Search InfoMatters (You can expand the search to the entire site)
Loading requested view (this could take a few moments)...
InfoMatters
Category: Research / Topics: Demographics • Social Movements • Statistics • Trends
The Changing Family
Reported by Stu Johnson
Building article list (this could take a few moments)...Posted: November 334, 2017
A profile from the U.S. Census Bureau
I recently received two reports from the U.S. Census Bureau that reveal changes in the shape of the American family, some of them quite striking. I have added brief summaries in bold at the beginning of each section. The details are from the Census Bureau report.
The first report, dated November 16 was headlined “Over One-Quarter of Children Under Age 18 Live with One Parent”
CHILDREN LIVING WITH ONE PARENT
More than one-quarter of children under 18 live with one parent
A slight rise in the number living with the father
Most common status for mother is never married, for father divorced
The percentage of children living with one parent who live with just their father saw an increase from 12.5 percent in 2007 to 16.1 percent in 2017. That’s according to new statistics from the U.S. Census Bureau’s 2017 America’s Families and Living Arrangements table package.
“A higher percentage of children living with one parent live with their fathers than a decade ago,” said Rose Kreider, a demographer in the Fertility and Family Statistics Branch at the Census Bureau. “However, the majority of children living with one parent still live with their mothers.”
In 2017, 83.9 percent of children living with one parent live with their mothers, compared to 86.0 percent in 2012 and 87.5 percent in 2007.
Overall, nearly 20 million children under age 18 live with one parent, composing 27.1 percent of all living arrangements for children under age 18. In 2007, 25.8 percent of children under age 18 lived with one parent, and in 2012, one of the highest intervening years, 28.3 percent of children under age 18 lived with one parent.
Of children who live with one parent, the most common marital status of the mother is never married (49 percent). The most common marital status of the father is divorced (43 percent). For children who live with their mother only, the largest proportions are ages 6 to 11 (36 percent), and ages 12 to 17 (35 percent). For children who live with their father only, the largest proportions are ages 12 to 17 (43 percent), followed by the proportion ages 6 to 11 (31 percent).
“The age distribution of children under age 18 who live with one parent shows a higher proportion of children living with their mother only are younger than children living with their father only,” Kreider said.
There continues to be racial and ethnic variation in living arrangements for children under age 18. Today, over half (52.8 percent) of black alone children live with one parent, compared to 29.1 percent of Hispanic children and 22.4 percent of white alone children.
Other highlights:
HOUSEHOLDS
Getting smaller, fewer with five or more people, more with only one person
White householders down 10-percent since 1970
- White householders make up 79 percent of all households in the United States, down from 89 percent in 1970. Black and Hispanic householders each make up 13 percent of households, while Asian householders comprise 5 percent. (Hispanics may be any race so percentages will not add to 100.)
- Households have grown smaller over time, reflecting the decrease in family size and the rise of living alone. The average number of people living in each household has declined from 3.7 people in 1940 to 2.5 today.
- In 2017, there are 35.3 million single-person households, composing 28 percent of all households. In 1960, single-person households represented only 13 percent of all households.
- Today less than 1 in 10 households (9 percent) have five or more people living in them – a decrease from 23 percent of households in 1960.
MARRIAGE & FAMILY
Median age for first marriage approaching 30, up significantly since 1947
One in three men and three in ten women have never been married
Married couple households have dropped from 93- to 69-percent since 1950
- In 2017, the median age when adults first marry is 29.5 for men and 27.4 for women, up from ages 23.7 and 20.5, respectively, in 1947. In 2017, less than one-third of all adults (32 percent) have never been married, up from 23 percent in 1950.
- More men (35 percent) than women (29 percent) have never been married in 2017 compared to 26 percent of men and 20 percent of women in 1950.
- Married couples make up 69 percent of all families with children under age 18, compared to 93 percent in 1950.
- In 19 percent of married-couple households, neither the husband nor wife is in the labor force. Among married-couple households with neither spouse in the labor force, 75 percent are age 65 and older.
- Over a quarter (26 percent) of children under the age of 15 who live in married-couple families have a stay at home mother, compared to only 1 percent who have a stay at home father.
LIVING ARRANGEMENTS OF ADULTS & CHILDREN
More than half of young adults (18-24) live in the parental home
Nearly 5-million parents living with children under 18 are unmarried cohabitating
- Over half (55 percent) of young adults ages 18 to 24 live in the parental home, compared to 16 percent of young adults ages 25 to 34.
- Of the 64 million parents living with children under the age of 18, 4.9 million (8 percent) are unmarried cohabiting parents.
- Most adults between the ages of 65 to 74 still live with a spouse. For men in this age group, 72 percent live with a spouse, while for women the percentage is 56 percent. For adults age 75 and older, however, the percentage of those living with a spouse drops to 66 percent for men and just 33 percent for women.
UNMARRIED COUPLES
There are nearly 8 million unmarried opposite-sex couples living together
Of those, more than one-third live with children under the age of 18
- In 2017, there are 7.8 million unmarried opposite-sex couples living together.
- Of the unmarried opposite-sex couples living together, 37 percent live with children under the age of 18.
- Statistics about same-sex couples are available from the American Community Survey.
These statistics come from the 2017 Current Population Survey Annual Social and Economic Supplement, which has collected statistics on families for more than 60 years. The data shows characteristics of households, living arrangements, married and unmarried couples, and children.
For more information, see Families and Living Arrangements or visit census.gov.
CHILDREN LIVING WITH A PARENT WHO WORKS NONSTANDARD HOURS
More than four in ten children affected
A second related report, called “Parents Burning the Midnight Oil” appeared in my inbox November 21. The report was written by Brian Knop of the Fertility and Family Statistics division of the Census Bureau. The detailed tables and charts in Brian’s blog have not been included here. As he states, the blog does not address the circumstances that lead to parents working nonstandard schedules, but does show the magnitude of the situation. (Emphasis in text added).
Of the 72.3 million children in the United States living with at least one of their parents, 43 percent (31.0 million) live with a parent who is working a nonstandard schedule. Any schedule that does not reflect the traditional Monday through Friday daytime schedule is considered nonstandard. Parents with more than one job are considered nonstandard workers if any of the jobs have nonstandard schedules, such as evenings/nights, irregular or weekend hours.
However, in today’s 24/7 economy, many jobs exist outside the traditional daytime, Monday-Friday work schedule. It is common for a child to live with a parent who works at least some shifts in the late (or early) parts of the day or during the weekend. For example, there are 5.5 million children living with their mother only who works a nonstandard schedule. This accounts for 30 percent of all children living with their mother only.
Both mothers and fathers, and parents with or without another parent in the home engage in nonstandard work schedules – see the Survey of Income and Program Participation (SIPP). This survey is the premier source of information for income and program participation. SIPP collects data and measures change for many topics including, economic well-being, family dynamics, education, assets, health insurance, childcare and food security. This survey includes detailed questions about family living arrangements and employment.
Of the 3.3 million children living with only their father, 37 percent have a dad who works a nonstandard schedule. The percentage with a father who works a nonstandard schedule increases to 49 percent when we consider only those children whose father is employed. This is similar to the corresponding percentage for children living only with an employed mother who is working a nonstandard schedule (47 percent). Among the 48.4 million children living with two parents, 50 percent have at least one parent working a nonstandard schedule. When restricted to children living with two working parents, 61 percent have at least one parent who works a nonstandard schedule.
A higher share of children in two-parent families have a father with a nonstandard schedule (38 percent) than a mother with a nonstandard schedule (22 percent). If we look within this group of children and focus on those with two working parents in the home, 37 percent have a mother working a nonstandard schedule and 43 percent have a father working a nonstandard schedule. Of course, these may overlap so that some children live with parents who both work nonstandard schedules. What percentage of children living with two employed parents have only mom or only dad working a nonstandard schedule? While 18 percent of children living with two working parents have both parents working nonstandard schedules, it is more common that only the father works a nonstandard schedule — 24 percent. About 18 percent of children living with two working parents have only a mother who works a nonstandard schedule.
It is important to note that this blog does not address the circumstances that lead parents to work nonstandard schedules. However, SIPP data do allow us to see that many children live with a parent who works a nonstandard schedule.
To learn more about SIPP and the statistical guidelines used in producing this blog, visit the SIPP page, the SIPP 2014 source and accuracy document and the nonresponse bias report.
The estimates presented in this blog are subject to sampling and nonsampling error. For more information, visit the SIPP sampling page.
The definition and shape of family in America is not static. There have been dramatic changes, especially in the decades since the stereotypical families of suburban America flickered on the television screens of the 1950s, a new medium that itself would have profound effects on the family.
This blog was also posted as an article on SeniorLifestyle.org.
Posted: November 334, 2017 Accessed 5,388 times
![]() Go to the list of most recent InfoMatters Blogs
Go to the list of most recent InfoMatters Blogs
![]() Search InfoMatters (You can expand the search to the entire site)
Search InfoMatters (You can expand the search to the entire site)
Loading requested view (this could take a few moments)...InfoMatters
Category: Research / Topics: Demographics • Social Movements • Statistics • Trends
The Changing Family
Reported by Stu Johnson
Building article list (this could take a few moments)...Posted: November 334, 2017
A profile from the U.S. Census Bureau
I recently received two reports from the U.S. Census Bureau that reveal changes in the shape of the American family, some of them quite striking. I have added brief summaries in bold at the beginning of each section. The details are from the Census Bureau report.
The first report, dated November 16 was headlined “Over One-Quarter of Children Under Age 18 Live with One Parent”
CHILDREN LIVING WITH ONE PARENT
More than one-quarter of children under 18 live with one parent
A slight rise in the number living with the father
Most common status for mother is never married, for father divorced
The percentage of children living with one parent who live with just their father saw an increase from 12.5 percent in 2007 to 16.1 percent in 2017. That’s according to new statistics from the U.S. Census Bureau’s 2017 America’s Families and Living Arrangements table package.
“A higher percentage of children living with one parent live with their fathers than a decade ago,” said Rose Kreider, a demographer in the Fertility and Family Statistics Branch at the Census Bureau. “However, the majority of children living with one parent still live with their mothers.”
In 2017, 83.9 percent of children living with one parent live with their mothers, compared to 86.0 percent in 2012 and 87.5 percent in 2007.
Overall, nearly 20 million children under age 18 live with one parent, composing 27.1 percent of all living arrangements for children under age 18. In 2007, 25.8 percent of children under age 18 lived with one parent, and in 2012, one of the highest intervening years, 28.3 percent of children under age 18 lived with one parent.
Of children who live with one parent, the most common marital status of the mother is never married (49 percent). The most common marital status of the father is divorced (43 percent). For children who live with their mother only, the largest proportions are ages 6 to 11 (36 percent), and ages 12 to 17 (35 percent). For children who live with their father only, the largest proportions are ages 12 to 17 (43 percent), followed by the proportion ages 6 to 11 (31 percent).
“The age distribution of children under age 18 who live with one parent shows a higher proportion of children living with their mother only are younger than children living with their father only,” Kreider said.
There continues to be racial and ethnic variation in living arrangements for children under age 18. Today, over half (52.8 percent) of black alone children live with one parent, compared to 29.1 percent of Hispanic children and 22.4 percent of white alone children.
Other highlights:
HOUSEHOLDS
Getting smaller, fewer with five or more people, more with only one person
White householders down 10-percent since 1970
- White householders make up 79 percent of all households in the United States, down from 89 percent in 1970. Black and Hispanic householders each make up 13 percent of households, while Asian householders comprise 5 percent. (Hispanics may be any race so percentages will not add to 100.)
- Households have grown smaller over time, reflecting the decrease in family size and the rise of living alone. The average number of people living in each household has declined from 3.7 people in 1940 to 2.5 today.
- In 2017, there are 35.3 million single-person households, composing 28 percent of all households. In 1960, single-person households represented only 13 percent of all households.
- Today less than 1 in 10 households (9 percent) have five or more people living in them – a decrease from 23 percent of households in 1960.
MARRIAGE & FAMILY
Median age for first marriage approaching 30, up significantly since 1947
One in three men and three in ten women have never been married
Married couple households have dropped from 93- to 69-percent since 1950
- In 2017, the median age when adults first marry is 29.5 for men and 27.4 for women, up from ages 23.7 and 20.5, respectively, in 1947. In 2017, less than one-third of all adults (32 percent) have never been married, up from 23 percent in 1950.
- More men (35 percent) than women (29 percent) have never been married in 2017 compared to 26 percent of men and 20 percent of women in 1950.
- Married couples make up 69 percent of all families with children under age 18, compared to 93 percent in 1950.
- In 19 percent of married-couple households, neither the husband nor wife is in the labor force. Among married-couple households with neither spouse in the labor force, 75 percent are age 65 and older.
- Over a quarter (26 percent) of children under the age of 15 who live in married-couple families have a stay at home mother, compared to only 1 percent who have a stay at home father.
LIVING ARRANGEMENTS OF ADULTS & CHILDREN
More than half of young adults (18-24) live in the parental home
Nearly 5-million parents living with children under 18 are unmarried cohabitating
- Over half (55 percent) of young adults ages 18 to 24 live in the parental home, compared to 16 percent of young adults ages 25 to 34.
- Of the 64 million parents living with children under the age of 18, 4.9 million (8 percent) are unmarried cohabiting parents.
- Most adults between the ages of 65 to 74 still live with a spouse. For men in this age group, 72 percent live with a spouse, while for women the percentage is 56 percent. For adults age 75 and older, however, the percentage of those living with a spouse drops to 66 percent for men and just 33 percent for women.
UNMARRIED COUPLES
There are nearly 8 million unmarried opposite-sex couples living together
Of those, more than one-third live with children under the age of 18
- In 2017, there are 7.8 million unmarried opposite-sex couples living together.
- Of the unmarried opposite-sex couples living together, 37 percent live with children under the age of 18.
- Statistics about same-sex couples are available from the American Community Survey.
These statistics come from the 2017 Current Population Survey Annual Social and Economic Supplement, which has collected statistics on families for more than 60 years. The data shows characteristics of households, living arrangements, married and unmarried couples, and children.
For more information, see Families and Living Arrangements or visit census.gov.
CHILDREN LIVING WITH A PARENT WHO WORKS NONSTANDARD HOURS
More than four in ten children affected
A second related report, called “Parents Burning the Midnight Oil” appeared in my inbox November 21. The report was written by Brian Knop of the Fertility and Family Statistics division of the Census Bureau. The detailed tables and charts in Brian’s blog have not been included here. As he states, the blog does not address the circumstances that lead to parents working nonstandard schedules, but does show the magnitude of the situation. (Emphasis in text added).
Of the 72.3 million children in the United States living with at least one of their parents, 43 percent (31.0 million) live with a parent who is working a nonstandard schedule. Any schedule that does not reflect the traditional Monday through Friday daytime schedule is considered nonstandard. Parents with more than one job are considered nonstandard workers if any of the jobs have nonstandard schedules, such as evenings/nights, irregular or weekend hours.
However, in today’s 24/7 economy, many jobs exist outside the traditional daytime, Monday-Friday work schedule. It is common for a child to live with a parent who works at least some shifts in the late (or early) parts of the day or during the weekend. For example, there are 5.5 million children living with their mother only who works a nonstandard schedule. This accounts for 30 percent of all children living with their mother only.
Both mothers and fathers, and parents with or without another parent in the home engage in nonstandard work schedules – see the Survey of Income and Program Participation (SIPP). This survey is the premier source of information for income and program participation. SIPP collects data and measures change for many topics including, economic well-being, family dynamics, education, assets, health insurance, childcare and food security. This survey includes detailed questions about family living arrangements and employment.
Of the 3.3 million children living with only their father, 37 percent have a dad who works a nonstandard schedule. The percentage with a father who works a nonstandard schedule increases to 49 percent when we consider only those children whose father is employed. This is similar to the corresponding percentage for children living only with an employed mother who is working a nonstandard schedule (47 percent). Among the 48.4 million children living with two parents, 50 percent have at least one parent working a nonstandard schedule. When restricted to children living with two working parents, 61 percent have at least one parent who works a nonstandard schedule.
A higher share of children in two-parent families have a father with a nonstandard schedule (38 percent) than a mother with a nonstandard schedule (22 percent). If we look within this group of children and focus on those with two working parents in the home, 37 percent have a mother working a nonstandard schedule and 43 percent have a father working a nonstandard schedule. Of course, these may overlap so that some children live with parents who both work nonstandard schedules. What percentage of children living with two employed parents have only mom or only dad working a nonstandard schedule? While 18 percent of children living with two working parents have both parents working nonstandard schedules, it is more common that only the father works a nonstandard schedule — 24 percent. About 18 percent of children living with two working parents have only a mother who works a nonstandard schedule.
It is important to note that this blog does not address the circumstances that lead parents to work nonstandard schedules. However, SIPP data do allow us to see that many children live with a parent who works a nonstandard schedule.
To learn more about SIPP and the statistical guidelines used in producing this blog, visit the SIPP page, the SIPP 2014 source and accuracy document and the nonresponse bias report.
The estimates presented in this blog are subject to sampling and nonsampling error. For more information, visit the SIPP sampling page.
The definition and shape of family in America is not static. There have been dramatic changes, especially in the decades since the stereotypical families of suburban America flickered on the television screens of the 1950s, a new medium that itself would have profound effects on the family.
This blog was also posted as an article on SeniorLifestyle.org.
Posted: November 334, 2017 Accessed 5,389 times
![]() Go to the list of most recent InfoMatters Blogs
Go to the list of most recent InfoMatters Blogs
![]() Search InfoMatters (You can expand the search to the entire site)
Search InfoMatters (You can expand the search to the entire site)
Loading requested view (this could take a few moments)...