Making Information Make Sense
InfoMatters
Category: Information / Topics: Ethics • Government • Information • Media • Opinion research • Religion
Seeing Can be Deceiving
by Stu Johnson
 Building article list (this could take a few moments)...
Posted: February 50, 2016
Thoughts on doctored images and misrepresenting data in charts…
In this post I want to take a look at two different angles on the importance of the truthful presentation of visuals that struck me this week.
The Doctored Rubio-Obama Picture
As an aide to GOP presidential candidate Ted Cruz said this morning on at least one of the news shows, “Everyone Photoshops,” referring to the latest accusation of “dirty tricks.” This instance refers to an image in a Cruz ad critical of Marco Rubio and “The Rubio-Obama Trade Pact.”
The image was obviously doctored. Here’s the original, a stock photo discovered by a number of people (below left). The background was replaced with an image of the capitol; the heads of Rubio and Obama placed on the bodies from the source image. In flipping the photo (below right), however, they end up shaking left hands.
It is easy—and fun—to manipulate images in Photoshop® and it is done a lot. Here, the doctoring was so obvious (especially the reversed handshake) that I wonder if it was felt that somehow that made it acceptable—more like a photo illustration intended to make a point. But does that make it right? And what about the notion that everyone does it?
The photo caused enough of an uproar that the ad has been revised with a picture of Rubio shaking Obama’s hand as the president made his way down the aisle for a State of the Union address—that, of course, is not as powerful since there is such a scramble for handshakes from both sides of the aisle at such events.
While Rubio complained about the Cruz ad, an ad for Rubio proclaiming a new day in America reportedly used the skyline of Vancouver, British Columbia. There are a host of other examples, most attributed to sloppy production under intense time deadlines—and we’re still early in the primaries! It only promises to get worse.
Even when there is no intention to deceive (I'm thinking of ads that support a candidate), it can backfire and negatively impact credibility. Why should the image not match what the script is saying? And why doctor photos when many should be available (if what is being represented is factual)? Incidentally, I would not consider replacing a background, such as the capitol, as doctoring when done to increase impact or establish context--as long as the intention is not to deceive the viewer into thinking the photo was taken at a specific location whether for good or ill intent.
Personally, I use Photoshop® regularly and have developed considerable expertise with it over many years. It is an effective tool for improving the appearance of photos—enhancing contrast, sharpness, color balance, cropping for composition, etc. It can be very satisfying to create complex montages, photo illustrations, or composite photos (for example, putting myself in a group photo when I forget to bring a tripod); taking full advantage of all the tools available.
Enhancing an image or creating a composite photo illustration is an art that can support the truth and increase the power of a message. On the other hand, doctoring—deceptively altering or compositing an image—crosses an ethical line. If a client were to ask that I knowingly manipulate a photo to create a false impression, I would find that unacceptable.
We go to movies willingly expecting to suspend belief, but should there not be a different standard in “real life”? In the public arena if truth is so easily dispensable in advertising images and other communication, what assurance do we have that it does not reflect the character of the person or organization?
Altering Perceptions in Charts
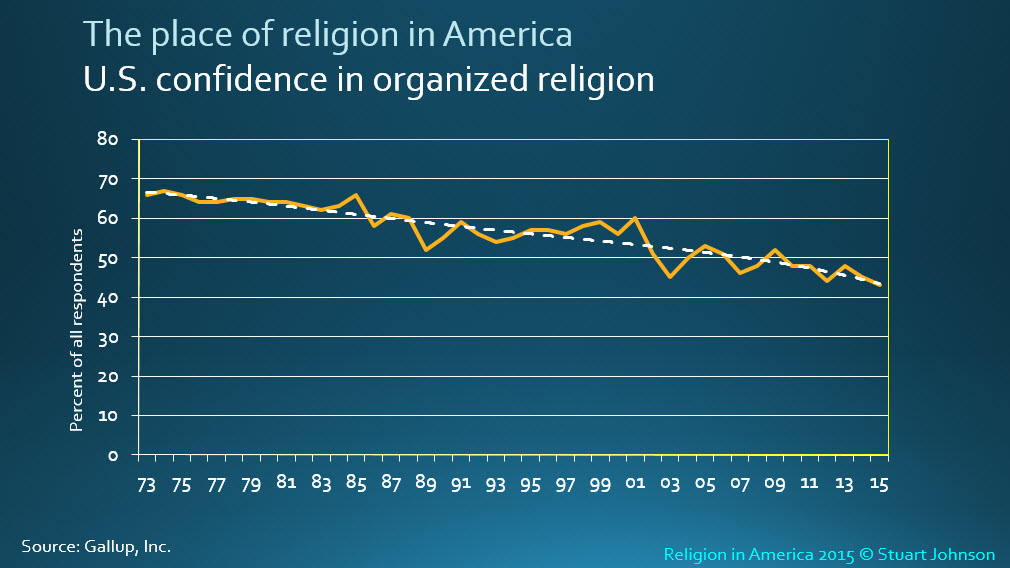
As I was wrapping up an update to the Religion in America summary on my website this week, I was reminded of the impression created by the way charts are presented. Here’s a simple example from that report. Gallup surveys about confidence of Americans in 15 key institutions show a general decline since teh survey began in 1973. One chart in my summary looked specifically at confidence in organized religion. Here is how it is formatted in the report:
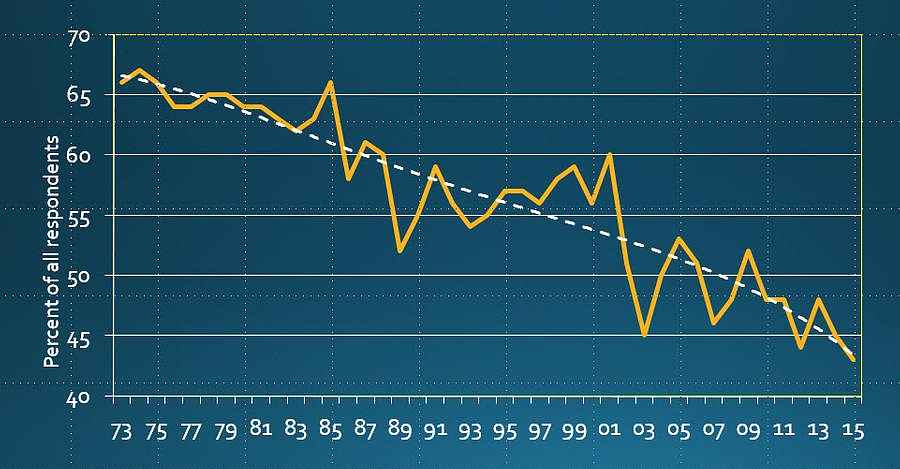
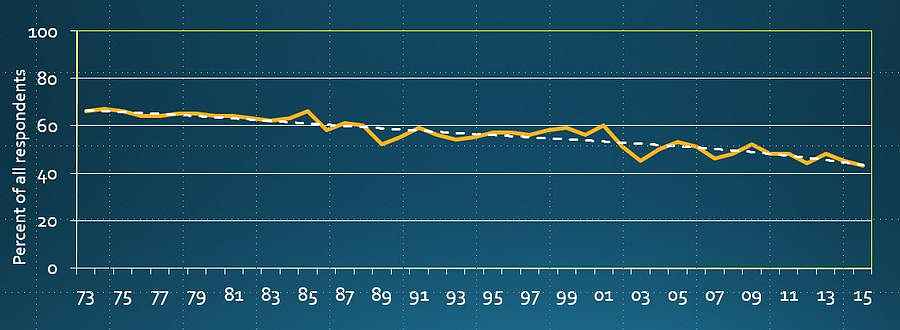
By manipulating the chart, it is possible to affect the perception of the rate of change—making it appear worse or less severe. To make it look more severe (below top), the Y-axis (vertical) has been reduced in range and the width of the chart has been squeezed. To make it look less severe (below bottom), the full 100-percent range of the Y-axis is used and the chart is stretched horizontally. In this case, it is much easier to exaggerate than attenuate the slope.
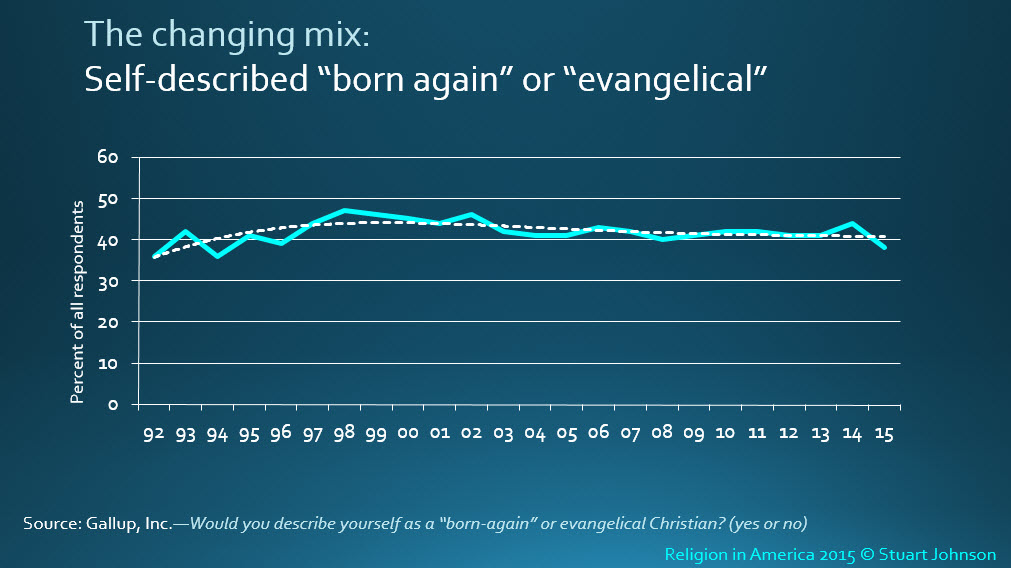
Another example is a chart showing the number of respondents who call themselves “born-again” or evangelical. Here is how it appears in the report:
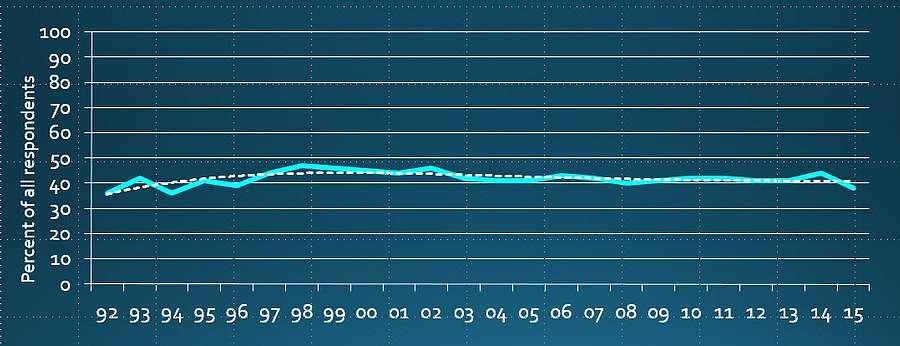
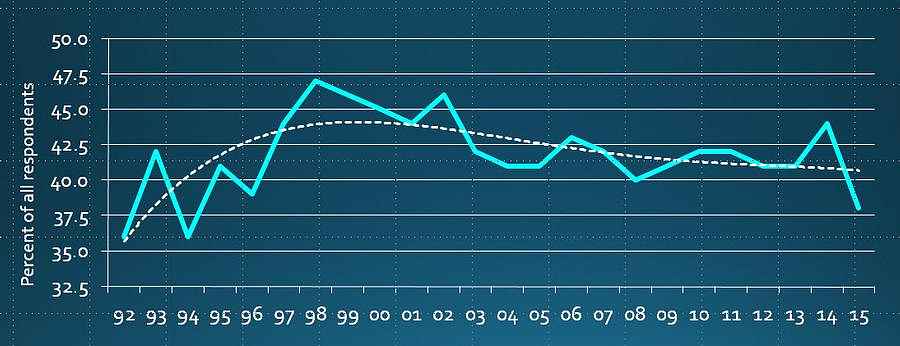
The trend is relatively flat. Limiting the Y-axis to 60% was deemed to be an adequate level of detail, though using the full 100% (below top) might be said to put it in better context. On the other hand, “zooming in” (below bottom) by restricting the Y-axis to a range of 32.5% to 50% exaggerates the changes from year to year. Used in the proper context this can be helpful—suggesting significance of year-to-year changes. However, this can be very risky given the distortions of margin of error in the survey and, in this case, using published results rounded to whole percentage points. The trend line is actually more meaningful in this case.
“Drilling down” or “zooming in” should only be done when there is fine enough “granularity” in the data to make it accurate (a pet peeve of mine exercised when some clients want more detail than is warranted). Otherwise, the less precise “30,000-foot view” is more appropriate to describe a long-term trend.
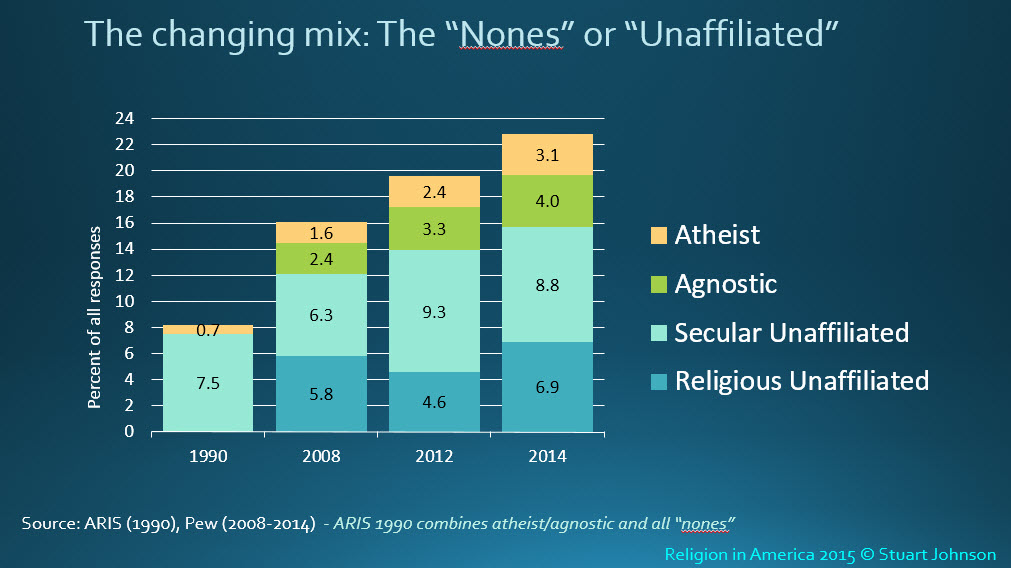
One final example comes from a stacked-column chart detailing the distribution of people with no preference for affiliation with an organized religious group (widely referred to as “the nones”). The top chart shows the data with a 100% Y-axis, but this makes it hard to see the detail. Thus, the report used a reduced scale with a maximum of 24% to appropriately zoom in. While this could seem to make the sectors appear unrealistically large, other charts in the report put the combined proportion of the “nones” or “unaffiliated” in the context of all respondents. .
When dealing with graphic displays of information, select the most appropriate type of chart out of many available and scale it in a way that fairly presents it to the reader. Avoid conscious attempts to manipulate the chart to fit an agenda or the bias of the presenter.
Yes, seeing can be deceiving! So, let’s strive to bring illumination while remaining truthful, fair and objective in the use of the data.
Search all articles by Stu Johnson
 Building article list (this could take a few moments) ...
Stu Johnson is owner of Stuart Johnson & Associates, a communications consultancy in Wheaton, Illinois focused on "making information make sense."
• E-mail the author (moc.setaicossajs@uts*)* For web-based email, you may need to copy and paste the address yourself.
Posted: February 50, 2016 Accessed 4,113 times
![]() Go to the list of most recent InfoMatters Blogs
Go to the list of most recent InfoMatters Blogs
![]() Search InfoMatters (You can expand the search to the entire site)
Search InfoMatters (You can expand the search to the entire site)
 Loading requested view (this could take a few moments)...
InfoMatters
Category: Information / Topics: Ethics • Government • Information • Media • Opinion research • Religion
Seeing Can be Deceiving
by Stu Johnson
 Building article list (this could take a few moments)...
Posted: February 50, 2016
Thoughts on doctored images and misrepresenting data in charts…
In this post I want to take a look at two different angles on the importance of the truthful presentation of visuals that struck me this week.
The Doctored Rubio-Obama Picture
As an aide to GOP presidential candidate Ted Cruz said this morning on at least one of the news shows, “Everyone Photoshops,” referring to the latest accusation of “dirty tricks.” This instance refers to an image in a Cruz ad critical of Marco Rubio and “The Rubio-Obama Trade Pact.”
The image was obviously doctored. Here’s the original, a stock photo discovered by a number of people (below left). The background was replaced with an image of the capitol; the heads of Rubio and Obama placed on the bodies from the source image. In flipping the photo (below right), however, they end up shaking left hands.
It is easy—and fun—to manipulate images in Photoshop® and it is done a lot. Here, the doctoring was so obvious (especially the reversed handshake) that I wonder if it was felt that somehow that made it acceptable—more like a photo illustration intended to make a point. But does that make it right? And what about the notion that everyone does it?
The photo caused enough of an uproar that the ad has been revised with a picture of Rubio shaking Obama’s hand as the president made his way down the aisle for a State of the Union address—that, of course, is not as powerful since there is such a scramble for handshakes from both sides of the aisle at such events.
While Rubio complained about the Cruz ad, an ad for Rubio proclaiming a new day in America reportedly used the skyline of Vancouver, British Columbia. There are a host of other examples, most attributed to sloppy production under intense time deadlines—and we’re still early in the primaries! It only promises to get worse.
Even when there is no intention to deceive (I'm thinking of ads that support a candidate), it can backfire and negatively impact credibility. Why should the image not match what the script is saying? And why doctor photos when many should be available (if what is being represented is factual)? Incidentally, I would not consider replacing a background, such as the capitol, as doctoring when done to increase impact or establish context--as long as the intention is not to deceive the viewer into thinking the photo was taken at a specific location whether for good or ill intent.
Personally, I use Photoshop® regularly and have developed considerable expertise with it over many years. It is an effective tool for improving the appearance of photos—enhancing contrast, sharpness, color balance, cropping for composition, etc. It can be very satisfying to create complex montages, photo illustrations, or composite photos (for example, putting myself in a group photo when I forget to bring a tripod); taking full advantage of all the tools available.
Enhancing an image or creating a composite photo illustration is an art that can support the truth and increase the power of a message. On the other hand, doctoring—deceptively altering or compositing an image—crosses an ethical line. If a client were to ask that I knowingly manipulate a photo to create a false impression, I would find that unacceptable.
We go to movies willingly expecting to suspend belief, but should there not be a different standard in “real life”? In the public arena if truth is so easily dispensable in advertising images and other communication, what assurance do we have that it does not reflect the character of the person or organization?
Altering Perceptions in Charts
As I was wrapping up an update to the Religion in America summary on my website this week, I was reminded of the impression created by the way charts are presented. Here’s a simple example from that report. Gallup surveys about confidence of Americans in 15 key institutions show a general decline since teh survey began in 1973. One chart in my summary looked specifically at confidence in organized religion. Here is how it is formatted in the report:
By manipulating the chart, it is possible to affect the perception of the rate of change—making it appear worse or less severe. To make it look more severe (below top), the Y-axis (vertical) has been reduced in range and the width of the chart has been squeezed. To make it look less severe (below bottom), the full 100-percent range of the Y-axis is used and the chart is stretched horizontally. In this case, it is much easier to exaggerate than attenuate the slope.
Another example is a chart showing the number of respondents who call themselves “born-again” or evangelical. Here is how it appears in the report:
The trend is relatively flat. Limiting the Y-axis to 60% was deemed to be an adequate level of detail, though using the full 100% (below top) might be said to put it in better context. On the other hand, “zooming in” (below bottom) by restricting the Y-axis to a range of 32.5% to 50% exaggerates the changes from year to year. Used in the proper context this can be helpful—suggesting significance of year-to-year changes. However, this can be very risky given the distortions of margin of error in the survey and, in this case, using published results rounded to whole percentage points. The trend line is actually more meaningful in this case.
“Drilling down” or “zooming in” should only be done when there is fine enough “granularity” in the data to make it accurate (a pet peeve of mine exercised when some clients want more detail than is warranted). Otherwise, the less precise “30,000-foot view” is more appropriate to describe a long-term trend.
One final example comes from a stacked-column chart detailing the distribution of people with no preference for affiliation with an organized religious group (widely referred to as “the nones”). The top chart shows the data with a 100% Y-axis, but this makes it hard to see the detail. Thus, the report used a reduced scale with a maximum of 24% to appropriately zoom in. While this could seem to make the sectors appear unrealistically large, other charts in the report put the combined proportion of the “nones” or “unaffiliated” in the context of all respondents. .
When dealing with graphic displays of information, select the most appropriate type of chart out of many available and scale it in a way that fairly presents it to the reader. Avoid conscious attempts to manipulate the chart to fit an agenda or the bias of the presenter.
Yes, seeing can be deceiving! So, let’s strive to bring illumination while remaining truthful, fair and objective in the use of the data.
Search all articles by Stu Johnson
 Building article list (this could take a few moments) ...
Stu Johnson is owner of Stuart Johnson & Associates, a communications consultancy in Wheaton, Illinois focused on "making information make sense."
• E-mail the author (moc.setaicossajs@uts*)* For web-based email, you may need to copy and paste the address yourself.
Posted: February 50, 2016 Accessed 4,114 times
![]() Go to the list of most recent InfoMatters Blogs
Go to the list of most recent InfoMatters Blogs
![]() Search InfoMatters (You can expand the search to the entire site)
Search InfoMatters (You can expand the search to the entire site)
 Loading requested view (this could take a few moments)...
InfoMatters
Category: Information / Topics: Ethics • Government • Information • Media • Opinion research • Religion
Seeing Can be Deceiving
by Stu Johnson
 Building article list (this could take a few moments)...
Posted: February 50, 2016
Thoughts on doctored images and misrepresenting data in charts…
In this post I want to take a look at two different angles on the importance of the truthful presentation of visuals that struck me this week.
The Doctored Rubio-Obama Picture
As an aide to GOP presidential candidate Ted Cruz said this morning on at least one of the news shows, “Everyone Photoshops,” referring to the latest accusation of “dirty tricks.” This instance refers to an image in a Cruz ad critical of Marco Rubio and “The Rubio-Obama Trade Pact.”
The image was obviously doctored. Here’s the original, a stock photo discovered by a number of people (below left). The background was replaced with an image of the capitol; the heads of Rubio and Obama placed on the bodies from the source image. In flipping the photo (below right), however, they end up shaking left hands.
It is easy—and fun—to manipulate images in Photoshop® and it is done a lot. Here, the doctoring was so obvious (especially the reversed handshake) that I wonder if it was felt that somehow that made it acceptable—more like a photo illustration intended to make a point. But does that make it right? And what about the notion that everyone does it?
The photo caused enough of an uproar that the ad has been revised with a picture of Rubio shaking Obama’s hand as the president made his way down the aisle for a State of the Union address—that, of course, is not as powerful since there is such a scramble for handshakes from both sides of the aisle at such events.
While Rubio complained about the Cruz ad, an ad for Rubio proclaiming a new day in America reportedly used the skyline of Vancouver, British Columbia. There are a host of other examples, most attributed to sloppy production under intense time deadlines—and we’re still early in the primaries! It only promises to get worse.
Even when there is no intention to deceive (I'm thinking of ads that support a candidate), it can backfire and negatively impact credibility. Why should the image not match what the script is saying? And why doctor photos when many should be available (if what is being represented is factual)? Incidentally, I would not consider replacing a background, such as the capitol, as doctoring when done to increase impact or establish context--as long as the intention is not to deceive the viewer into thinking the photo was taken at a specific location whether for good or ill intent.
Personally, I use Photoshop® regularly and have developed considerable expertise with it over many years. It is an effective tool for improving the appearance of photos—enhancing contrast, sharpness, color balance, cropping for composition, etc. It can be very satisfying to create complex montages, photo illustrations, or composite photos (for example, putting myself in a group photo when I forget to bring a tripod); taking full advantage of all the tools available.
Enhancing an image or creating a composite photo illustration is an art that can support the truth and increase the power of a message. On the other hand, doctoring—deceptively altering or compositing an image—crosses an ethical line. If a client were to ask that I knowingly manipulate a photo to create a false impression, I would find that unacceptable.
We go to movies willingly expecting to suspend belief, but should there not be a different standard in “real life”? In the public arena if truth is so easily dispensable in advertising images and other communication, what assurance do we have that it does not reflect the character of the person or organization?
Altering Perceptions in Charts
As I was wrapping up an update to the Religion in America summary on my website this week, I was reminded of the impression created by the way charts are presented. Here’s a simple example from that report. Gallup surveys about confidence of Americans in 15 key institutions show a general decline since teh survey began in 1973. One chart in my summary looked specifically at confidence in organized religion. Here is how it is formatted in the report:
By manipulating the chart, it is possible to affect the perception of the rate of change—making it appear worse or less severe. To make it look more severe (below top), the Y-axis (vertical) has been reduced in range and the width of the chart has been squeezed. To make it look less severe (below bottom), the full 100-percent range of the Y-axis is used and the chart is stretched horizontally. In this case, it is much easier to exaggerate than attenuate the slope.
Another example is a chart showing the number of respondents who call themselves “born-again” or evangelical. Here is how it appears in the report:
The trend is relatively flat. Limiting the Y-axis to 60% was deemed to be an adequate level of detail, though using the full 100% (below top) might be said to put it in better context. On the other hand, “zooming in” (below bottom) by restricting the Y-axis to a range of 32.5% to 50% exaggerates the changes from year to year. Used in the proper context this can be helpful—suggesting significance of year-to-year changes. However, this can be very risky given the distortions of margin of error in the survey and, in this case, using published results rounded to whole percentage points. The trend line is actually more meaningful in this case.
“Drilling down” or “zooming in” should only be done when there is fine enough “granularity” in the data to make it accurate (a pet peeve of mine exercised when some clients want more detail than is warranted). Otherwise, the less precise “30,000-foot view” is more appropriate to describe a long-term trend.
One final example comes from a stacked-column chart detailing the distribution of people with no preference for affiliation with an organized religious group (widely referred to as “the nones”). The top chart shows the data with a 100% Y-axis, but this makes it hard to see the detail. Thus, the report used a reduced scale with a maximum of 24% to appropriately zoom in. While this could seem to make the sectors appear unrealistically large, other charts in the report put the combined proportion of the “nones” or “unaffiliated” in the context of all respondents. .
When dealing with graphic displays of information, select the most appropriate type of chart out of many available and scale it in a way that fairly presents it to the reader. Avoid conscious attempts to manipulate the chart to fit an agenda or the bias of the presenter.
Yes, seeing can be deceiving! So, let’s strive to bring illumination while remaining truthful, fair and objective in the use of the data.
Search all articles by Stu Johnson
 Building article list (this could take a few moments) ...
Stu Johnson is owner of Stuart Johnson & Associates, a communications consultancy in Wheaton, Illinois focused on "making information make sense."
• E-mail the author (moc.setaicossajs@uts*)* For web-based email, you may need to copy and paste the address yourself.
Posted: February 50, 2016 Accessed 4,115 times
![]() Go to the list of most recent InfoMatters Blogs
Go to the list of most recent InfoMatters Blogs
![]() Search InfoMatters (You can expand the search to the entire site)
Search InfoMatters (You can expand the search to the entire site)
 Loading requested view (this could take a few moments)...