
Making Information Make Sense
InfoMatters
Category: Government / Topics: Demographics • Government • Opinion research • Research Methodology • Statistics • Trends
A Divide too Wide?
by Stu Johnson
 Building article list (this could take a few moments)...
Posted: March 69, 2020
The state of the Democratic race after Super Tuesday…
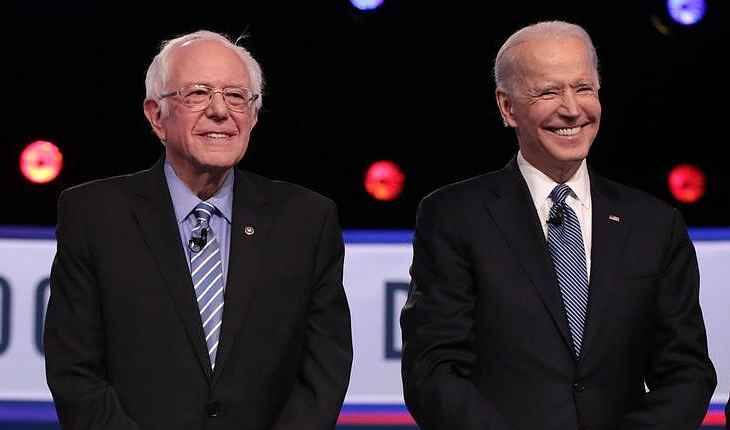
The run-up to Super Tuesday was full of twists and turns as a wide and diverse field of candidates suddenly collapsed to become essentially a horse race between two veterans of Democratic politics—both of whom, as has been pointed out by more than one pundit, are white and in their late 70s, one characterized as leading a Revolution, the other a Return..
Until the South Carolina primary the previous Saturday breathed life into the seemingly waning campaign of Joe Biden, the opposition to front-runner Bernie Sanders failed to coalesce around a single candidate. That left Sanders with a plurality of votes (and resulting delegates) but far from the majority that would be needed to gain the Democratic nomination. Indeed, through the weekend and even into the hours before the Super Tuesday primaries, a sizable number of those not supporting Sanders were uncertain who to support. Some were helped in their decision when Minnesota senator Amy Klobuchar and former South Bend mayor Pete Buttigieg dropped out over the weekend.
Democrats have agreed on one thing from the beginning (the 2016 election, that is): that Donald Trump must not win a second term. But that unity masks deep divides within the party, at least this side of the convention in Milwaukee in mid-July. The dividing lines were clear in the exit polling on Super Tuesday. Before looking at results from one widely-used poll, let's consider a few things about those polls.
Using exit polls: a need for caution
Exit polls began decades ago by news media eager to forecast winners as soon as possible after polling places closed. The first expressions of this came as extra editions of newspapers, then driven ever harder by the immediacy of radio following World War I and the fierce competition of television as it spread from a novelty in metropolitan areas after World II into a nationwide system dominated by three networks—ABC, CBS and NBC—by the late 50s. Exit polls were conducted by intercepting people at polling places who were willing to answer a short series of questions about their voting experience and preferences..
When I was involved as a student volunteer for Wheaton College radio station WETN during the 1964 election, the station made some extra money when students were recruited to conduct exit polling for one of the networks. That was before the polls tried to go beyond the basics of who you voted for and some basic demographic data (age, sex, party).
Over the years, exit polls had to become more disciplined—waiting (impatiently!) in national elections until polling places on the west coast closed to avoid influencing voting there—and more detailed, with increased demographic and voting preference data. They also became harder to conduct with the increase in early voting, mail-in ballots, and other alternatives to physical appearance at a precinct polling place on election day.
Unlike standard opinion research, which attempts to gather a representative sample of the target population ("random" in the sense that statistically everyone has the same chance of being in the sample). Exit polls, on the other hand, are not statistically random, so results are often weighted toward what is known about the voting population and historic patterns of turnout to, in reality, make the best guess. This, however, can lead to some wild distortions.
Therefore, I use exit polling with caution. It turns out, so are media outlets who have been burned by false or misleading predictions based on exit polling..
Due to problems with projections made during the 2016 presidential election, organizations conducting polls have had to re-examine their techniques and methodology. Some went even further. During the 2018 mid-term elections, Fox News collaborated with NORC (National Opinion Research Center) of the University of Chicago to use a mix of techniques, including traditional polling both before and after the election. This slowed down results, but made analysis far more accurate in the days following the election.
This year, NORC partnered with AP (Associated Press) in an effort called AP VoteCast, using a similar slower but more accurate approach. Exit polling is still used for immediate projections, but as indicated in the analysis below, it must be interpreted as the opinion "of those who responded."
Even traditional opinion polling (aimed at producing a statistically valid random sample) has had its challenges as technology has changed and it has become harder to make direct contact with people (answering machines, voice mail, dropping land lines in favor of smart phones, etc.).
Of course, the focus on politics and elections, with their associated polling, has continued to evolve with the introduction of cable and the Internet in the 1990s, bringing about 24-hour news and social media.
Back to Super Tuesday.
The results quoted here come from Edison Media Research for the National Election Pool, with a margin of error of 4%. It was used by a number of media outlets. I found the summary by the Washington Post to be exceptionally well presented.
The Washington Post analysis of Super Tuesday exit polls includes four candidates: Bernie Sanders, Joe Biden, Mike Bloomberg, and Elizabeth Warren. I included all four in the summary below since supporters of Bloomberg (who dropped out the day after the election) can be seen as having affinity with Biden, while supporters of Warren (who dropped out the following day) may be more conflicted, but basically lean toward the progressive elements of Sanders' appeal, at least at this point in time with the nominating convention still months away. .
- Sex
The breakdown of respondents by sex is not given, so read "of those who responded."- Male. About a third of males voted for Biden (36%) and slightly less for Sanders (32%). Bloomberg captured 12% and Warren 9%.
- Female. Biden and Bloomberg were similar to their male counterparts (37% and 13%), but Sanders' support dropped to 25% among females while 15% went with Warren.
- Race. The breakdown by race/ethnicity is not given, so read "of those who responded."
- White. Biden got a third (35%) of white votes, Sanders 27%, Warren 16%, and Bloomberg 13%.
- Black. Biden captured more than half (58%) of the black vote, Sanders 17%, Bloomberg 15%, and Warren 5%.
- Hispanic/Latino. A third (35%) voted for Sanders, a quarter (26%) Biden, 11% for Bloomberg and 8% for Warren.
- Asian. Four in ten (42%) voted for Sanders, 17% for Biden, 15% for Bloomberg, and 10% for Warren.
- Age. The breakdown by age is not given, so read "of those who responded."
- 18-29. This cohort went overwhelmingly for Sanders (60%), with Biden getting 17%, Warren 11%, and Bloomberg 4%.
- 30-44. Again, Sanders took a commanding lead here, with 41%. Biden got 23%, Warren 17%, and Bloomberg 8%.
- 45-64. Here, the voters shift toward Biden, with 43%. Sanders and Bloomberg each got 20%, and Warren 11%.
- 65 and older. Again, Biden prevails, with half (50%) of this cohort. Bloomberg was next at 18%, followed by Sanders at 15% and Warren at 9%..
- Party Self-Identification.
The breakdown by party identification is not given, so read "of those who responded."- Democrat. Biden captured four in ten (41%), following by Sanders (25%), Warren (14%) and Bloomberg (12%)
- Republican. A little stronger for Biden and Bloomberg, but remarkably similar to Democrats. Biden captured 43% of self-identified Republicans voting on a Democrat ballot, with Sanders narrowing slightly to 22%, Bloomberg up to 17%, and Warren dropping to 3%.
- Independent or something else. When looking at all four candidates, there is only a minor tilt in the liberal direction, though it is most noticeable at the top. Sanders captured a third (34%) of Independents, Biden got a quarter (26%), followed by Bloomberg (15%) and Warren (11%). Sanders and Warren combined received 45% of the Independent vote, Biden and Bloomberg got 41%, a difference that is close to the margin of error.
- Education. The breakdown by education is not given, so read "of those who responded."
- College Graduate. Biden captured a third (34%) of college graduate voters, Sanders a quarter (25%), Warren 17% and Bloomberg 12%.
- No College Degree. While Biden got more than a third (38%) of this group, Sanders was close at 33% (reflecting his favor among the youngest voters, including those still in college), with Bloomberg at 12% and Warren at 7%.
- Ideology.
The breakdown by ideology is not given, so read "of those who responded."
- Very Liberal. Sanders captured half (49%) of these voters, with Biden and Warren each getting 19%, and Bloomberg 5%.
- Somewhat Liberal. Here, the vote shifts to Biden with 39%, followed by Sanders (28%), Warren (15%) and Bloomberg (11%).
- Moderate or Conservative. Just as Sanders got half of the Very Liberal vote, Biden got nearly half (47%) at this end of the spectrum, trailed by Bloomberg at 19%, Sanders (17%) and Warren (6%).
- Most important issue in vote.
Four issues were reported in the Washington Post summary: No breakdown is given of the proportion selecting each option, so again read "of those who responded." They are reordered here according to the proportion of the leading vote.- Race relations. Of those respondents who chose this issue, nearly half (48%) voted for Biden, with less than a quarter (22%) voting for Sanders, 14% for Bloomberg, and 9% for Warren.
- Health Care. Similar to, but a little "flatter" than Race Relations, here four in ten respondents (40%) were Biden voters, with Sanders voters accounting for 28%, Bloomberg with 13% and Warren 10%..
- Income Inequality. Sanders' strongest issue, with a third (35%) of respondents calling this the most important issue. Biden was down to 28%, Warren up to 18%, and Bloomberg down to 9%.
- Climate Change. Things continue to flatten here, with Biden down to 34% of respondents who thought this the most important issue, Sanders still at 28%, Bloomberg remaining at 13%, and Warren up to 15%.,
- Rather nominate a candidate who...
The breakdown of position is not given, but of those who responded:- Agrees with you on major issues. Four in ten (39%) were Sander voters, 26% Biden, Bloomberg and Warren split the rest (12% and 11%).
- Can beat Donald Trump. This one flipped, with Biden voters accounting for 43% and Sanders 22%. Bloomberg and Warren again split the remaining voters, at 13% each.
- How do you feel about replacing all private health insurance with a single government plan for everyone?
The breakdown of position is not given, but of those who responded:- Support. Four in ten (40%) supporters were Sanders voters, a quarter (26%) Biden. 15% of were Warren voters, 9% voted for Bloomberg.
- Oppose. Half (49%) of those opposed voted for Biden, 21% were Bloomberg voters, 11% for Sanders. 7% for Warren.
- Is your opinion of socialism...
The breakdown of position is not given, but of those who responded:- Favorable. Four in ten (41%) who agreed were Sanders voters, a quarter (24%) were Biden voters., 16% voted for Warren and 8% for Bloomberg.
- Unfavorable. Half (48%) of respondents voted for Biden, 21% for Bloomberg, 11% for Sanders, and 7% for Warren.
Comparing Sanders and Biden
Where did the two leading candidates get their greatest support in the14 Super Tuesday primaries? Here we see the considerable divide between them. (Even with my caution in using exit polls, the differences here are so great that they cannot be accounted for by sampling error or survey design).
- SANDERS.
- Ages 18 to 19 (60%)
- Very Liberal (49%)
- Ages 30 to 44 (41%)
- Favorable view of socialism (41%)
- Support changing to single government health plan (40%)
- BIDEN.
- Black (58%)
- Ages 65 and older (50%)
- Oppose changing to single government health plan (49%)
- Unfavorable view of socialism (48%)
- Top issue: Race relations (48%)
A divide too wide?
For Democrats, the road to Milwaukee will continue to highlight the divisions between Bernie Sanders on the liberal end and the more moderate opposition, which coalesced around Joe Biden on Super Tuesday. Major Garrett of CBSN commented in the aftermath of Super Tuesday that he does not hold to the "instant conventional wisdom" and "absolute certainty" of making predictions, since they have already changed several times as Elizabeth Warren seemed so promising early on, followed by Pete Buttigeig's rise and Joe Biden nearly being written off before Jim Clybourn endorsed him in South Carolina. Within a few days we now have Sanders and Biden as front-runners. What could happen in the time remaining before and during the convention?
As long as Sanders remains in the race, his candidacy offers an opportunity for voters across the political spectrum to consider the meaning of democracy in America (more accurately, our representative republic). The differences of perspective may help us consider our current political economy—the three-legged stool of government, commerce/industry and banking/finance—where the accepted "conventional wisdom" embraces the idea that big is good ("too big to fail") and the question in Washington is which of the three should have control? How does this concentration of power—whether Wall Street, Amazon, or Washington—impact us as citizens (or are we, as some have suggested, no longer citizens but consumers and data points)?
Let's not jump ahead to speculate on the November election, as tempting as that may be. With the type of divide going into its convention, the question for Democrats will be whether such disparate and strongly held views can be subsumed in order to rally in common cause—before, during, or after the convention—all of which will affect Republican strategy. We still have a very interesting and unpredictable time ahead, wherever we place ourselves on the political spectrum!
Search all articles by Stu Johnson
Building article list (this could take a few moments) ...Stu Johnson is owner of Stuart Johnson & Associates, a communications consultancy in Wheaton, Illinois focused on "making information make sense."
• E-mail the author (moc.setaicossajs@uts*)* For web-based email, you may need to copy and paste the address yourself.
Posted: March 69, 2020 Accessed 1,363 times
![]() Go to the list of most recent InfoMatters Blogs
Go to the list of most recent InfoMatters Blogs
![]() Search InfoMatters (You can expand the search to the entire site)
Search InfoMatters (You can expand the search to the entire site)
Loading requested view (this could take a few moments)...We can't solve problems by using the same kind of thinking we used when we created them.

InfoMatters
Category: Government / Topics: Demographics • Government • Opinion research • Research Methodology • Statistics • Trends
A Divide too Wide?
by Stu Johnson
Building article list (this could take a few moments)...Posted: March 69, 2020
The state of the Democratic race after Super Tuesday…
The run-up to Super Tuesday was full of twists and turns as a wide and diverse field of candidates suddenly collapsed to become essentially a horse race between two veterans of Democratic politics—both of whom, as has been pointed out by more than one pundit, are white and in their late 70s, one characterized as leading a Revolution, the other a Return..
Until the South Carolina primary the previous Saturday breathed life into the seemingly waning campaign of Joe Biden, the opposition to front-runner Bernie Sanders failed to coalesce around a single candidate. That left Sanders with a plurality of votes (and resulting delegates) but far from the majority that would be needed to gain the Democratic nomination. Indeed, through the weekend and even into the hours before the Super Tuesday primaries, a sizable number of those not supporting Sanders were uncertain who to support. Some were helped in their decision when Minnesota senator Amy Klobuchar and former South Bend mayor Pete Buttigieg dropped out over the weekend.
Democrats have agreed on one thing from the beginning (the 2016 election, that is): that Donald Trump must not win a second term. But that unity masks deep divides within the party, at least this side of the convention in Milwaukee in mid-July. The dividing lines were clear in the exit polling on Super Tuesday. Before looking at results from one widely-used poll, let's consider a few things about those polls.
Using exit polls: a need for caution
Exit polls began decades ago by news media eager to forecast winners as soon as possible after polling places closed. The first expressions of this came as extra editions of newspapers, then driven ever harder by the immediacy of radio following World War I and the fierce competition of television as it spread from a novelty in metropolitan areas after World II into a nationwide system dominated by three networks—ABC, CBS and NBC—by the late 50s. Exit polls were conducted by intercepting people at polling places who were willing to answer a short series of questions about their voting experience and preferences..
When I was involved as a student volunteer for Wheaton College radio station WETN during the 1964 election, the station made some extra money when students were recruited to conduct exit polling for one of the networks. That was before the polls tried to go beyond the basics of who you voted for and some basic demographic data (age, sex, party).
Over the years, exit polls had to become more disciplined—waiting (impatiently!) in national elections until polling places on the west coast closed to avoid influencing voting there—and more detailed, with increased demographic and voting preference data. They also became harder to conduct with the increase in early voting, mail-in ballots, and other alternatives to physical appearance at a precinct polling place on election day.
Unlike standard opinion research, which attempts to gather a representative sample of the target population ("random" in the sense that statistically everyone has the same chance of being in the sample). Exit polls, on the other hand, are not statistically random, so results are often weighted toward what is known about the voting population and historic patterns of turnout to, in reality, make the best guess. This, however, can lead to some wild distortions.
Therefore, I use exit polling with caution. It turns out, so are media outlets who have been burned by false or misleading predictions based on exit polling..
Due to problems with projections made during the 2016 presidential election, organizations conducting polls have had to re-examine their techniques and methodology. Some went even further. During the 2018 mid-term elections, Fox News collaborated with NORC (National Opinion Research Center) of the University of Chicago to use a mix of techniques, including traditional polling both before and after the election. This slowed down results, but made analysis far more accurate in the days following the election.
This year, NORC partnered with AP (Associated Press) in an effort called AP VoteCast, using a similar slower but more accurate approach. Exit polling is still used for immediate projections, but as indicated in the analysis below, it must be interpreted as the opinion "of those who responded."
Even traditional opinion polling (aimed at producing a statistically valid random sample) has had its challenges as technology has changed and it has become harder to make direct contact with people (answering machines, voice mail, dropping land lines in favor of smart phones, etc.).
Of course, the focus on politics and elections, with their associated polling, has continued to evolve with the introduction of cable and the Internet in the 1990s, bringing about 24-hour news and social media.
Back to Super Tuesday.
The results quoted here come from Edison Media Research for the National Election Pool, with a margin of error of 4%. It was used by a number of media outlets. I found the summary by the Washington Post to be exceptionally well presented.
The Washington Post analysis of Super Tuesday exit polls includes four candidates: Bernie Sanders, Joe Biden, Mike Bloomberg, and Elizabeth Warren. I included all four in the summary below since supporters of Bloomberg (who dropped out the day after the election) can be seen as having affinity with Biden, while supporters of Warren (who dropped out the following day) may be more conflicted, but basically lean toward the progressive elements of Sanders' appeal, at least at this point in time with the nominating convention still months away. .
- Sex
The breakdown of respondents by sex is not given, so read "of those who responded."- Male. About a third of males voted for Biden (36%) and slightly less for Sanders (32%). Bloomberg captured 12% and Warren 9%.
- Female. Biden and Bloomberg were similar to their male counterparts (37% and 13%), but Sanders' support dropped to 25% among females while 15% went with Warren.
- Race. The breakdown by race/ethnicity is not given, so read "of those who responded."
- White. Biden got a third (35%) of white votes, Sanders 27%, Warren 16%, and Bloomberg 13%.
- Black. Biden captured more than half (58%) of the black vote, Sanders 17%, Bloomberg 15%, and Warren 5%.
- Hispanic/Latino. A third (35%) voted for Sanders, a quarter (26%) Biden, 11% for Bloomberg and 8% for Warren.
- Asian. Four in ten (42%) voted for Sanders, 17% for Biden, 15% for Bloomberg, and 10% for Warren.
- Age. The breakdown by age is not given, so read "of those who responded."
- 18-29. This cohort went overwhelmingly for Sanders (60%), with Biden getting 17%, Warren 11%, and Bloomberg 4%.
- 30-44. Again, Sanders took a commanding lead here, with 41%. Biden got 23%, Warren 17%, and Bloomberg 8%.
- 45-64. Here, the voters shift toward Biden, with 43%. Sanders and Bloomberg each got 20%, and Warren 11%.
- 65 and older. Again, Biden prevails, with half (50%) of this cohort. Bloomberg was next at 18%, followed by Sanders at 15% and Warren at 9%..
- Party Self-Identification.
The breakdown by party identification is not given, so read "of those who responded."- Democrat. Biden captured four in ten (41%), following by Sanders (25%), Warren (14%) and Bloomberg (12%)
- Republican. A little stronger for Biden and Bloomberg, but remarkably similar to Democrats. Biden captured 43% of self-identified Republicans voting on a Democrat ballot, with Sanders narrowing slightly to 22%, Bloomberg up to 17%, and Warren dropping to 3%.
- Independent or something else. When looking at all four candidates, there is only a minor tilt in the liberal direction, though it is most noticeable at the top. Sanders captured a third (34%) of Independents, Biden got a quarter (26%), followed by Bloomberg (15%) and Warren (11%). Sanders and Warren combined received 45% of the Independent vote, Biden and Bloomberg got 41%, a difference that is close to the margin of error.
- Education. The breakdown by education is not given, so read "of those who responded."
- College Graduate. Biden captured a third (34%) of college graduate voters, Sanders a quarter (25%), Warren 17% and Bloomberg 12%.
- No College Degree. While Biden got more than a third (38%) of this group, Sanders was close at 33% (reflecting his favor among the youngest voters, including those still in college), with Bloomberg at 12% and Warren at 7%.
- Ideology.
The breakdown by ideology is not given, so read "of those who responded."
- Very Liberal. Sanders captured half (49%) of these voters, with Biden and Warren each getting 19%, and Bloomberg 5%.
- Somewhat Liberal. Here, the vote shifts to Biden with 39%, followed by Sanders (28%), Warren (15%) and Bloomberg (11%).
- Moderate or Conservative. Just as Sanders got half of the Very Liberal vote, Biden got nearly half (47%) at this end of the spectrum, trailed by Bloomberg at 19%, Sanders (17%) and Warren (6%).
- Most important issue in vote.
Four issues were reported in the Washington Post summary: No breakdown is given of the proportion selecting each option, so again read "of those who responded." They are reordered here according to the proportion of the leading vote.- Race relations. Of those respondents who chose this issue, nearly half (48%) voted for Biden, with less than a quarter (22%) voting for Sanders, 14% for Bloomberg, and 9% for Warren.
- Health Care. Similar to, but a little "flatter" than Race Relations, here four in ten respondents (40%) were Biden voters, with Sanders voters accounting for 28%, Bloomberg with 13% and Warren 10%..
- Income Inequality. Sanders' strongest issue, with a third (35%) of respondents calling this the most important issue. Biden was down to 28%, Warren up to 18%, and Bloomberg down to 9%.
- Climate Change. Things continue to flatten here, with Biden down to 34% of respondents who thought this the most important issue, Sanders still at 28%, Bloomberg remaining at 13%, and Warren up to 15%.,
- Rather nominate a candidate who...
The breakdown of position is not given, but of those who responded:- Agrees with you on major issues. Four in ten (39%) were Sander voters, 26% Biden, Bloomberg and Warren split the rest (12% and 11%).
- Can beat Donald Trump. This one flipped, with Biden voters accounting for 43% and Sanders 22%. Bloomberg and Warren again split the remaining voters, at 13% each.
- How do you feel about replacing all private health insurance with a single government plan for everyone?
The breakdown of position is not given, but of those who responded:- Support. Four in ten (40%) supporters were Sanders voters, a quarter (26%) Biden. 15% of were Warren voters, 9% voted for Bloomberg.
- Oppose. Half (49%) of those opposed voted for Biden, 21% were Bloomberg voters, 11% for Sanders. 7% for Warren.
- Is your opinion of socialism...
The breakdown of position is not given, but of those who responded:- Favorable. Four in ten (41%) who agreed were Sanders voters, a quarter (24%) were Biden voters., 16% voted for Warren and 8% for Bloomberg.
- Unfavorable. Half (48%) of respondents voted for Biden, 21% for Bloomberg, 11% for Sanders, and 7% for Warren.
Comparing Sanders and Biden
Where did the two leading candidates get their greatest support in the14 Super Tuesday primaries? Here we see the considerable divide between them. (Even with my caution in using exit polls, the differences here are so great that they cannot be accounted for by sampling error or survey design).
- SANDERS.
- Ages 18 to 19 (60%)
- Very Liberal (49%)
- Ages 30 to 44 (41%)
- Favorable view of socialism (41%)
- Support changing to single government health plan (40%)
- BIDEN.
- Black (58%)
- Ages 65 and older (50%)
- Oppose changing to single government health plan (49%)
- Unfavorable view of socialism (48%)
- Top issue: Race relations (48%)
A divide too wide?
For Democrats, the road to Milwaukee will continue to highlight the divisions between Bernie Sanders on the liberal end and the more moderate opposition, which coalesced around Joe Biden on Super Tuesday. Major Garrett of CBSN commented in the aftermath of Super Tuesday that he does not hold to the "instant conventional wisdom" and "absolute certainty" of making predictions, since they have already changed several times as Elizabeth Warren seemed so promising early on, followed by Pete Buttigeig's rise and Joe Biden nearly being written off before Jim Clybourn endorsed him in South Carolina. Within a few days we now have Sanders and Biden as front-runners. What could happen in the time remaining before and during the convention?
As long as Sanders remains in the race, his candidacy offers an opportunity for voters across the political spectrum to consider the meaning of democracy in America (more accurately, our representative republic). The differences of perspective may help us consider our current political economy—the three-legged stool of government, commerce/industry and banking/finance—where the accepted "conventional wisdom" embraces the idea that big is good ("too big to fail") and the question in Washington is which of the three should have control? How does this concentration of power—whether Wall Street, Amazon, or Washington—impact us as citizens (or are we, as some have suggested, no longer citizens but consumers and data points)?
Let's not jump ahead to speculate on the November election, as tempting as that may be. With the type of divide going into its convention, the question for Democrats will be whether such disparate and strongly held views can be subsumed in order to rally in common cause—before, during, or after the convention—all of which will affect Republican strategy. We still have a very interesting and unpredictable time ahead, wherever we place ourselves on the political spectrum!
Search all articles by Stu Johnson
Building article list (this could take a few moments) ...Stu Johnson is owner of Stuart Johnson & Associates, a communications consultancy in Wheaton, Illinois focused on "making information make sense."
• E-mail the author (moc.setaicossajs@uts*)* For web-based email, you may need to copy and paste the address yourself.
Posted: March 69, 2020 Accessed 1,364 times
![]() Go to the list of most recent InfoMatters Blogs
Go to the list of most recent InfoMatters Blogs
![]() Search InfoMatters (You can expand the search to the entire site)
Search InfoMatters (You can expand the search to the entire site)
Loading requested view (this could take a few moments)...InfoMatters
Category: Government / Topics: Demographics • Government • Opinion research • Research Methodology • Statistics • Trends
A Divide too Wide?
by Stu Johnson
Building article list (this could take a few moments)...Posted: March 69, 2020
The state of the Democratic race after Super Tuesday…
The run-up to Super Tuesday was full of twists and turns as a wide and diverse field of candidates suddenly collapsed to become essentially a horse race between two veterans of Democratic politics—both of whom, as has been pointed out by more than one pundit, are white and in their late 70s, one characterized as leading a Revolution, the other a Return..
Until the South Carolina primary the previous Saturday breathed life into the seemingly waning campaign of Joe Biden, the opposition to front-runner Bernie Sanders failed to coalesce around a single candidate. That left Sanders with a plurality of votes (and resulting delegates) but far from the majority that would be needed to gain the Democratic nomination. Indeed, through the weekend and even into the hours before the Super Tuesday primaries, a sizable number of those not supporting Sanders were uncertain who to support. Some were helped in their decision when Minnesota senator Amy Klobuchar and former South Bend mayor Pete Buttigieg dropped out over the weekend.
Democrats have agreed on one thing from the beginning (the 2016 election, that is): that Donald Trump must not win a second term. But that unity masks deep divides within the party, at least this side of the convention in Milwaukee in mid-July. The dividing lines were clear in the exit polling on Super Tuesday. Before looking at results from one widely-used poll, let's consider a few things about those polls.
Using exit polls: a need for caution
Exit polls began decades ago by news media eager to forecast winners as soon as possible after polling places closed. The first expressions of this came as extra editions of newspapers, then driven ever harder by the immediacy of radio following World War I and the fierce competition of television as it spread from a novelty in metropolitan areas after World II into a nationwide system dominated by three networks—ABC, CBS and NBC—by the late 50s. Exit polls were conducted by intercepting people at polling places who were willing to answer a short series of questions about their voting experience and preferences..
When I was involved as a student volunteer for Wheaton College radio station WETN during the 1964 election, the station made some extra money when students were recruited to conduct exit polling for one of the networks. That was before the polls tried to go beyond the basics of who you voted for and some basic demographic data (age, sex, party).
Over the years, exit polls had to become more disciplined—waiting (impatiently!) in national elections until polling places on the west coast closed to avoid influencing voting there—and more detailed, with increased demographic and voting preference data. They also became harder to conduct with the increase in early voting, mail-in ballots, and other alternatives to physical appearance at a precinct polling place on election day.
Unlike standard opinion research, which attempts to gather a representative sample of the target population ("random" in the sense that statistically everyone has the same chance of being in the sample). Exit polls, on the other hand, are not statistically random, so results are often weighted toward what is known about the voting population and historic patterns of turnout to, in reality, make the best guess. This, however, can lead to some wild distortions.
Therefore, I use exit polling with caution. It turns out, so are media outlets who have been burned by false or misleading predictions based on exit polling..
Due to problems with projections made during the 2016 presidential election, organizations conducting polls have had to re-examine their techniques and methodology. Some went even further. During the 2018 mid-term elections, Fox News collaborated with NORC (National Opinion Research Center) of the University of Chicago to use a mix of techniques, including traditional polling both before and after the election. This slowed down results, but made analysis far more accurate in the days following the election.
This year, NORC partnered with AP (Associated Press) in an effort called AP VoteCast, using a similar slower but more accurate approach. Exit polling is still used for immediate projections, but as indicated in the analysis below, it must be interpreted as the opinion "of those who responded."
Even traditional opinion polling (aimed at producing a statistically valid random sample) has had its challenges as technology has changed and it has become harder to make direct contact with people (answering machines, voice mail, dropping land lines in favor of smart phones, etc.).
Of course, the focus on politics and elections, with their associated polling, has continued to evolve with the introduction of cable and the Internet in the 1990s, bringing about 24-hour news and social media.
Back to Super Tuesday.
The results quoted here come from Edison Media Research for the National Election Pool, with a margin of error of 4%. It was used by a number of media outlets. I found the summary by the Washington Post to be exceptionally well presented.
The Washington Post analysis of Super Tuesday exit polls includes four candidates: Bernie Sanders, Joe Biden, Mike Bloomberg, and Elizabeth Warren. I included all four in the summary below since supporters of Bloomberg (who dropped out the day after the election) can be seen as having affinity with Biden, while supporters of Warren (who dropped out the following day) may be more conflicted, but basically lean toward the progressive elements of Sanders' appeal, at least at this point in time with the nominating convention still months away. .
- Sex
The breakdown of respondents by sex is not given, so read "of those who responded."- Male. About a third of males voted for Biden (36%) and slightly less for Sanders (32%). Bloomberg captured 12% and Warren 9%.
- Female. Biden and Bloomberg were similar to their male counterparts (37% and 13%), but Sanders' support dropped to 25% among females while 15% went with Warren.
- Race. The breakdown by race/ethnicity is not given, so read "of those who responded."
- White. Biden got a third (35%) of white votes, Sanders 27%, Warren 16%, and Bloomberg 13%.
- Black. Biden captured more than half (58%) of the black vote, Sanders 17%, Bloomberg 15%, and Warren 5%.
- Hispanic/Latino. A third (35%) voted for Sanders, a quarter (26%) Biden, 11% for Bloomberg and 8% for Warren.
- Asian. Four in ten (42%) voted for Sanders, 17% for Biden, 15% for Bloomberg, and 10% for Warren.
- Age. The breakdown by age is not given, so read "of those who responded."
- 18-29. This cohort went overwhelmingly for Sanders (60%), with Biden getting 17%, Warren 11%, and Bloomberg 4%.
- 30-44. Again, Sanders took a commanding lead here, with 41%. Biden got 23%, Warren 17%, and Bloomberg 8%.
- 45-64. Here, the voters shift toward Biden, with 43%. Sanders and Bloomberg each got 20%, and Warren 11%.
- 65 and older. Again, Biden prevails, with half (50%) of this cohort. Bloomberg was next at 18%, followed by Sanders at 15% and Warren at 9%..
- Party Self-Identification.
The breakdown by party identification is not given, so read "of those who responded."- Democrat. Biden captured four in ten (41%), following by Sanders (25%), Warren (14%) and Bloomberg (12%)
- Republican. A little stronger for Biden and Bloomberg, but remarkably similar to Democrats. Biden captured 43% of self-identified Republicans voting on a Democrat ballot, with Sanders narrowing slightly to 22%, Bloomberg up to 17%, and Warren dropping to 3%.
- Independent or something else. When looking at all four candidates, there is only a minor tilt in the liberal direction, though it is most noticeable at the top. Sanders captured a third (34%) of Independents, Biden got a quarter (26%), followed by Bloomberg (15%) and Warren (11%). Sanders and Warren combined received 45% of the Independent vote, Biden and Bloomberg got 41%, a difference that is close to the margin of error.
- Education. The breakdown by education is not given, so read "of those who responded."
- College Graduate. Biden captured a third (34%) of college graduate voters, Sanders a quarter (25%), Warren 17% and Bloomberg 12%.
- No College Degree. While Biden got more than a third (38%) of this group, Sanders was close at 33% (reflecting his favor among the youngest voters, including those still in college), with Bloomberg at 12% and Warren at 7%.
- Ideology.
The breakdown by ideology is not given, so read "of those who responded."
- Very Liberal. Sanders captured half (49%) of these voters, with Biden and Warren each getting 19%, and Bloomberg 5%.
- Somewhat Liberal. Here, the vote shifts to Biden with 39%, followed by Sanders (28%), Warren (15%) and Bloomberg (11%).
- Moderate or Conservative. Just as Sanders got half of the Very Liberal vote, Biden got nearly half (47%) at this end of the spectrum, trailed by Bloomberg at 19%, Sanders (17%) and Warren (6%).
- Most important issue in vote.
Four issues were reported in the Washington Post summary: No breakdown is given of the proportion selecting each option, so again read "of those who responded." They are reordered here according to the proportion of the leading vote.- Race relations. Of those respondents who chose this issue, nearly half (48%) voted for Biden, with less than a quarter (22%) voting for Sanders, 14% for Bloomberg, and 9% for Warren.
- Health Care. Similar to, but a little "flatter" than Race Relations, here four in ten respondents (40%) were Biden voters, with Sanders voters accounting for 28%, Bloomberg with 13% and Warren 10%..
- Income Inequality. Sanders' strongest issue, with a third (35%) of respondents calling this the most important issue. Biden was down to 28%, Warren up to 18%, and Bloomberg down to 9%.
- Climate Change. Things continue to flatten here, with Biden down to 34% of respondents who thought this the most important issue, Sanders still at 28%, Bloomberg remaining at 13%, and Warren up to 15%.,
- Rather nominate a candidate who...
The breakdown of position is not given, but of those who responded:- Agrees with you on major issues. Four in ten (39%) were Sander voters, 26% Biden, Bloomberg and Warren split the rest (12% and 11%).
- Can beat Donald Trump. This one flipped, with Biden voters accounting for 43% and Sanders 22%. Bloomberg and Warren again split the remaining voters, at 13% each.
- How do you feel about replacing all private health insurance with a single government plan for everyone?
The breakdown of position is not given, but of those who responded:- Support. Four in ten (40%) supporters were Sanders voters, a quarter (26%) Biden. 15% of were Warren voters, 9% voted for Bloomberg.
- Oppose. Half (49%) of those opposed voted for Biden, 21% were Bloomberg voters, 11% for Sanders. 7% for Warren.
- Is your opinion of socialism...
The breakdown of position is not given, but of those who responded:- Favorable. Four in ten (41%) who agreed were Sanders voters, a quarter (24%) were Biden voters., 16% voted for Warren and 8% for Bloomberg.
- Unfavorable. Half (48%) of respondents voted for Biden, 21% for Bloomberg, 11% for Sanders, and 7% for Warren.
Comparing Sanders and Biden
Where did the two leading candidates get their greatest support in the14 Super Tuesday primaries? Here we see the considerable divide between them. (Even with my caution in using exit polls, the differences here are so great that they cannot be accounted for by sampling error or survey design).
- SANDERS.
- Ages 18 to 19 (60%)
- Very Liberal (49%)
- Ages 30 to 44 (41%)
- Favorable view of socialism (41%)
- Support changing to single government health plan (40%)
- BIDEN.
- Black (58%)
- Ages 65 and older (50%)
- Oppose changing to single government health plan (49%)
- Unfavorable view of socialism (48%)
- Top issue: Race relations (48%)
A divide too wide?
For Democrats, the road to Milwaukee will continue to highlight the divisions between Bernie Sanders on the liberal end and the more moderate opposition, which coalesced around Joe Biden on Super Tuesday. Major Garrett of CBSN commented in the aftermath of Super Tuesday that he does not hold to the "instant conventional wisdom" and "absolute certainty" of making predictions, since they have already changed several times as Elizabeth Warren seemed so promising early on, followed by Pete Buttigeig's rise and Joe Biden nearly being written off before Jim Clybourn endorsed him in South Carolina. Within a few days we now have Sanders and Biden as front-runners. What could happen in the time remaining before and during the convention?
As long as Sanders remains in the race, his candidacy offers an opportunity for voters across the political spectrum to consider the meaning of democracy in America (more accurately, our representative republic). The differences of perspective may help us consider our current political economy—the three-legged stool of government, commerce/industry and banking/finance—where the accepted "conventional wisdom" embraces the idea that big is good ("too big to fail") and the question in Washington is which of the three should have control? How does this concentration of power—whether Wall Street, Amazon, or Washington—impact us as citizens (or are we, as some have suggested, no longer citizens but consumers and data points)?
Let's not jump ahead to speculate on the November election, as tempting as that may be. With the type of divide going into its convention, the question for Democrats will be whether such disparate and strongly held views can be subsumed in order to rally in common cause—before, during, or after the convention—all of which will affect Republican strategy. We still have a very interesting and unpredictable time ahead, wherever we place ourselves on the political spectrum!
Search all articles by Stu Johnson
Building article list (this could take a few moments) ...Stu Johnson is owner of Stuart Johnson & Associates, a communications consultancy in Wheaton, Illinois focused on "making information make sense."
• E-mail the author (moc.setaicossajs@uts*)* For web-based email, you may need to copy and paste the address yourself.
Posted: March 69, 2020 Accessed 1,365 times
![]() Go to the list of most recent InfoMatters Blogs
Go to the list of most recent InfoMatters Blogs
![]() Search InfoMatters (You can expand the search to the entire site)
Search InfoMatters (You can expand the search to the entire site)
Loading requested view (this could take a few moments)...